Capital One 2009 Annual Report Download - page 78
Download and view the complete annual report
Please find page 78 of the 2009 Capital One annual report below. You can navigate through the pages in the report by either clicking on the pages listed below, or by using the keyword search tool below to find specific information within the annual report.-
 1
1 -
2
-
3
-
4
-
5
-
6
-
7
-
8
-
9
-
10
-
11
-
12
-
13
-
14
-
15
-
16
-
17
-
18
-
19
-
20
-
21
-
22
-
23
-
24
-
25
-
26
-
27
-
28
-
29
-
30
-
31
-
32
-
33
-
34
-
35
-
36
-
37
-
38
-
39
-
40
-
41
-
42
-
43
-
44
-
45
-
46
-
47
-
48
-
49
-
50
-
51
-
52
-
53
-
54
-
55
-
56
-
57
-
58
-
59
-
60
-
61
-
62
-
63
-
64
-
65
-
66
-
67
-
 68
68 -
 69
69 -
 70
70 -
 71
71 -
 72
72 -
 73
73 -
 74
74 -
 75
75 -
 76
76 -
 77
77 -
 78
78 -
 79
79 -
 80
80 -
 81
81 -
 82
82 -
 83
83 -
 84
84 -
 85
85 -
 86
86 -
 87
87 -
 88
88 -
89
-
90
-
91
-
92
-
93
-
94
-
95
-
96
-
97
-
98
-
99
-
100
-
101
-
102
-
103
-
104
-
105
-
106
-
107
-
108
-
109
-
110
-
111
-
112
-
113
-
114
-
115
-
116
-
117
-
118
-
119
-
120
-
121
-
122
-
123
-
124
-
125
-
126
-
127
-
128
-
129
-
130
-
131
-
132
-
133
-
134
-
135
-
136
-
137
-
138
-
139
-
140
-
141
-
142
-
143
-
144
-
145
-
146
-
147
-
148
-
149
-
150
-
151
-
152
-
153
-
154
-
155
-
156
-
157
-
158
-
159
-
160
-
161
-
162
-
163
-
164
-
165
-
166
-
167
-
168
-
169
-
170
-
171
-
172
-
173
-
174
-
175
-
176
-
177
-
178
-
179
-
180
-
181
-
182
-
183
-
184
-
185
-
186
-
187
-
188
-
189
-
190
-
191
-
192
-
193
-
194
-
195
-
196
-
197
-
198
-
199
-
200
-
201
-
202
-
203
-
204
-
205
-
206
-
207
-
208
-
209
 |
 |

65
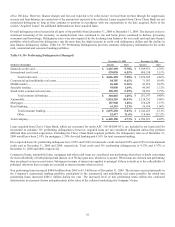
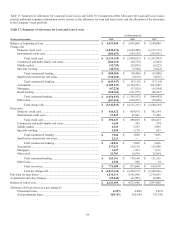
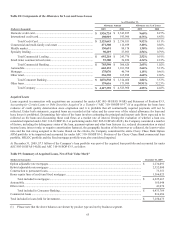
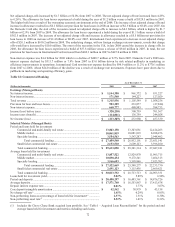
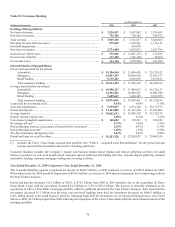
Table 18: Components of the Allowance for Loan and Lease Losses
As of December 31,
Allowance Amount Allowance as a % of Loans
(Dollars in thousands)
2009 2008 2009
2008
Domestic credit card ................................................................................. $ 1,926,724 $ 2,543,855 9.60% 8.27%
International credit card ............................................................................ 198,919 193,096 8.75% 6.45%
Total Credit Card ............................................................................ $ 2,125,643 $ 2,736,951 9.52% 8.11%
Commercial and multi-family real estate ................................................. 471,308 116,699 3.40% 0.88%
Middle market .......................................................................................... 130,691 99,178 1.30% 0.98%
Specialty lending ...................................................................................... 90,219 27,893 2.54% 0.79%
Total Commercial Lending ............................................................. $ 692,218 $ 243,770 2.52% 0.91%
Small ticket commercial real estate .......................................................... 93,380 56,850 4.34% 2.18%
Total Commercial Banking ............................................................. $ 785,598 $ 300,620 2.65% 1.02%
Automobile ............................................................................................... 665,132 1,101,708 3.66% 5.13%
Mortgage .................................................................................................. 175,076 46,794 1.18% 0.46%
Other retail ................................................................................................ 236,330 165,898 4.60% 2.96%
Total Consumer Banking ................................................................ $ 1,076,538 $ 1,314,400 2.82% 3.53%
Other loans ............................................................................................... 139,616 171,989 30.91% 32.23%
Total Company ............................................................................... $ 4,127,395 $ 4,523,960 4.55% 4.48%
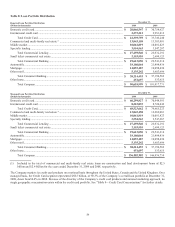
Acquired Loans
Loans acquired in connection with acquisitions are accounted for under ASC 805-10/SFAS 141(R) and Statement of Position 03-3,
Accounting for Certain Loans or Debt Securities Acquired in a Transfer (“ASC 310-10/SOP 03-3”) if at acquisition the loans have
evidence of credit quality deterioration since origination and it is probable that all contractually required payments will not be
collected. Under both statements, acquired loans are recorded at fair value and the carry-over of the related allowance for loan and
lease losses is prohibited. Determining fair value of the loans involves estimating the principal and interest cash flows expected to be
collected on the loans and discounting those cash flows at a market rate of interest. During the evaluation of whether a loan was
considered impaired under ASC 310-10/SOP 03-3 or performing under ASC 805-10/SFAS 141(R), the Company considered a number
of factors, including the delinquency status of the loan, payment options and other loan features (i.e. reduced documentation or stated
income loans, interest only, or negative amortization features), the geographic location of the borrower or collateral, the loan-to-value
ratio and the risk rating assigned to the loans. Based on the criteria, the Company considered the entire Chevy Chase Bank Option
ARM portfolio to be impaired and accounted for under ASC 310-10/SOP 03-3. Portions of the Chevy Chase Bank commercial loan
portfolio, HELOC portfolio and the fixed mortgage portfolio were also considered impaired.
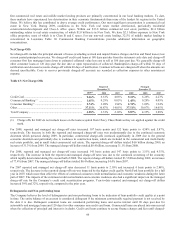
At December 31, 2009, $7.3 billion of the Company’s loan portfolio was part of the acquired loan portfolio and accounted for under
ASC 805-10/SFAS 141(R) and ASC 310-10/SOP 03-3, as follow:
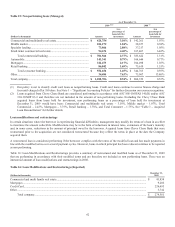
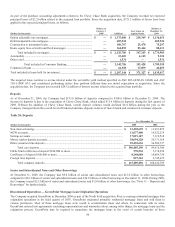
Table 19: Summary of Acquired Loans, Net of Fair Value Mark(1)
(Dollars in thousands) December 31, 2009
Option adjustable rate mortgages ................................................................................................................................
.
$ 2,234,091
Hybrid adjustable rate mortgages ...............................................................................................................................
.
2,352,000
Construction to permanent loans .................................................................................................................................
.
75,551
Home equity lines of credit and fixed mortgages .......................................................................................................
.
1,564,025
Total included in mortgages ..............................................................................................................................
.
$ 6,225,667
Automobile .................................................................................................................................................................
.
165,048
Other retail ..................................................................................................................................................................
.
43,074
Total included in Consumer Banking ................................................................................................................
.
$ 6,433,789
Commercial loans .......................................................................................................................................................
.
816,686
Total included in loans held for investment ................................................................................................................
.
$ 7,250,475
(1) Please note that the above balances are shown by product type and not by business segment.