Capital One 2009 Annual Report Download - page 169
Download and view the complete annual report
Please find page 169 of the 2009 Capital One annual report below. You can navigate through the pages in the report by either clicking on the pages listed below, or by using the keyword search tool below to find specific information within the annual report.-
 1
1 -
2
-
3
-
4
-
5
-
6
-
7
-
8
-
9
-
10
-
11
-
12
-
13
-
14
-
15
-
16
-
17
-
18
-
19
-
20
-
21
-
22
-
23
-
24
-
25
-
26
-
27
-
28
-
29
-
30
-
31
-
32
-
33
-
34
-
35
-
36
-
37
-
38
-
39
-
40
-
41
-
42
-
43
-
44
-
45
-
46
-
47
-
48
-
49
-
50
-
51
-
52
-
53
-
54
-
55
-
56
-
57
-
58
-
59
-
60
-
61
-
62
-
63
-
64
-
65
-
66
-
67
-
68
-
69
-
70
-
71
-
72
-
73
-
74
-
75
-
76
-
77
-
78
-
79
-
80
-
81
-
82
-
83
-
84
-
85
-
86
-
87
-
88
-
89
-
90
-
91
-
92
-
93
-
94
-
95
-
96
-
97
-
98
-
99
-
100
-
101
-
102
-
103
-
104
-
105
-
106
-
107
-
108
-
109
-
110
-
111
-
112
-
113
-
114
-
115
-
116
-
117
-
118
-
119
-
120
-
121
-
122
-
123
-
124
-
125
-
126
-
127
-
128
-
129
-
130
-
131
-
132
-
133
-
134
-
135
-
136
-
137
-
138
-
139
-
140
-
141
-
142
-
143
-
144
-
145
-
146
-
147
-
148
-
149
-
150
-
151
-
152
-
153
-
154
-
155
-
156
-
157
-
158
-
 159
159 -
 160
160 -
 161
161 -
 162
162 -
 163
163 -
 164
164 -
 165
165 -
 166
166 -
 167
167 -
 168
168 -
 169
169 -
 170
170 -
 171
171 -
 172
172 -
 173
173 -
 174
174 -
 175
175 -
 176
176 -
 177
177 -
 178
178 -
 179
179 -
180
-
181
-
182
-
183
-
184
-
185
-
186
-
187
-
188
-
189
-
190
-
191
-
192
-
193
-
194
-
195
-
196
-
197
-
198
-
199
-
200
-
201
-
202
-
203
-
204
-
205
-
206
-
207
-
208
-
209
 |
 |

156
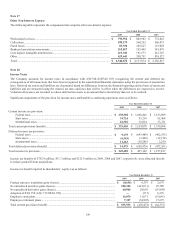
Note 17
Other Non-Interest Expense
The following table represents the components that comprise other non-interest expense:
Year Ended December 31
2009 2008
2007
Professional services ........................................................................................................ $ 795,952 $ 805,902 $ 772,022
Collections ....................................................................................................................... 599,179 568,552 560,075
Fraud losses ..................................................................................................................... 85,938 105,627 123,028
Bankcard association assessments ................................................................................... 215,017 195,469 181,076
Core deposit intangible amortization ............................................................................... 215,941 191,573 212,107
Other ................................................................................................................................ 628,643 290,751 538,527
Total ................................................................................................................................. $ 2,540,670 $ 2,157,874 $ 2,386,835
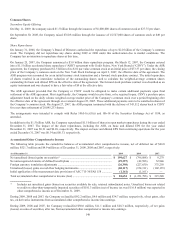
Note 18
Income Taxes
The Company accounts for income taxes in accordance with ASC740-10/SFAS 109, recognizing the current and deferred tax
consequences of all transactions that have been recognized in the consolidated financial statements using the provisions of enacted tax
laws. Deferred tax assets and liabilities are determined based on differences between the financial reporting and tax basis of assets and
liabilities and are measured using the enacted tax rates and laws that will be in effect when the differences are expected to reverse.
Valuation allowances are recorded to reduce deferred tax assets to an amount that is more likely than not to be realized.
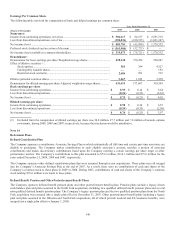
Significant components of the provision for income taxes attributable to continuing operations were as follows:
Year Ended December 31
2009 2008
2007
Current income tax provision:
Federal taxes ................................................................................................................. $ 278,304 $ 1,068,846 $ 1,613,909
State taxes ..................................................................................................................... 34,724 53,218 82,468
International taxes ......................................................................................................... 22,382 32,014 53,721
Total current provision (benefit) ............................................................................................ $ 335,410 $ 1,154,078 $ 1,750,098
Deferred income tax provision:
Federal taxes ................................................................................................................. $ 9,175 $ (643,488) $ (462,193)
State taxes ..................................................................................................................... (6,363) (3,202) (12,318)
International taxes ......................................................................................................... 11,263 (10,286) 2,250
Total deferred provision (benefit) .......................................................................................... $ 14,075 $ (656,976) $ (472,261)
Total income tax provision .....................................................................................................$ 349,485 $ 497,102 $ 1,277,837
Income tax benefits of $792.9 million, $31.7 million and $121.9 million in 2009, 2008 and 2007, respectively, were allocated directly
to reduce goodwill from acquisitions.
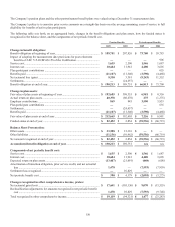
Income tax benefit reported in shareholders’ equity was as follows:
Year Ended December 31
2009
2008 2007
Foreign currency translation gains (losses) .............................................................................
.
$ (8,634) $ 6,597 $ 2,679
N
et unrealized securities gains (losses)...................................................................................
.
520,302 (421,011) 25,780
N
et unrealized derivative gains (losses) ..................................................................................
.
60,904 28,095 (63,804)
Adoption of FAS 158 (ASC 715/SFAS 158) ..........................................................................
.
— (317) 6,378
Employee stock plans .............................................................................................................
.
16,074 11,071 (53,041)
Employee retirement plans .....................................................................................................
.
7,307 (54,907) 17,675
Total current provision (benefit) .............................................................................................
.
$ 595,953 $ (430,472) $ (64,333)