Capital One 2009 Annual Report Download - page 40
Download and view the complete annual report
Please find page 40 of the 2009 Capital One annual report below. You can navigate through the pages in the report by either clicking on the pages listed below, or by using the keyword search tool below to find specific information within the annual report.-
 1
1 -
2
-
3
-
4
-
5
-
6
-
7
-
8
-
9
-
10
-
11
-
12
-
13
-
14
-
15
-
16
-
17
-
18
-
19
-
20
-
21
-
22
-
23
-
24
-
25
-
26
-
27
-
28
-
29
-
 30
30 -
 31
31 -
 32
32 -
 33
33 -
 34
34 -
 35
35 -
 36
36 -
 37
37 -
 38
38 -
 39
39 -
 40
40 -
 41
41 -
 42
42 -
 43
43 -
 44
44 -
 45
45 -
 46
46 -
 47
47 -
 48
48 -
 49
49 -
 50
50 -
51
-
52
-
53
-
54
-
55
-
56
-
57
-
58
-
59
-
60
-
61
-
62
-
63
-
64
-
65
-
66
-
67
-
68
-
69
-
70
-
71
-
72
-
73
-
74
-
75
-
76
-
77
-
78
-
79
-
80
-
81
-
82
-
83
-
84
-
85
-
86
-
87
-
88
-
89
-
90
-
91
-
92
-
93
-
94
-
95
-
96
-
97
-
98
-
99
-
100
-
101
-
102
-
103
-
104
-
105
-
106
-
107
-
108
-
109
-
110
-
111
-
112
-
113
-
114
-
115
-
116
-
117
-
118
-
119
-
120
-
121
-
122
-
123
-
124
-
125
-
126
-
127
-
128
-
129
-
130
-
131
-
132
-
133
-
134
-
135
-
136
-
137
-
138
-
139
-
140
-
141
-
142
-
143
-
144
-
145
-
146
-
147
-
148
-
149
-
150
-
151
-
152
-
153
-
154
-
155
-
156
-
157
-
158
-
159
-
160
-
161
-
162
-
163
-
164
-
165
-
166
-
167
-
168
-
169
-
170
-
171
-
172
-
173
-
174
-
175
-
176
-
177
-
178
-
179
-
180
-
181
-
182
-
183
-
184
-
185
-
186
-
187
-
188
-
189
-
190
-
191
-
192
-
193
-
194
-
195
-
196
-
197
-
198
-
199
-
200
-
201
-
202
-
203
-
204
-
205
-
206
-
207
-
208
-
209
 |
 |

27
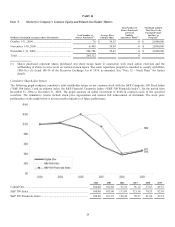
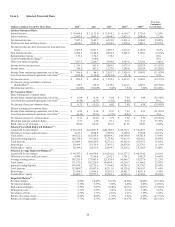
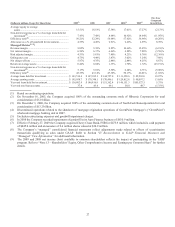
(Dollars in millions, Except Per Share Data)
2009(7) 2008 2007 2006(3)
2005(2)
Five Year
Compound
Growth Rate
Average equity to average
assets .......................................................................... 15.51% 16.18% 17.38% 17.01% 17.27% (2.13)%
N
on-interest expense as a % of average loans held for
investment(5) .............................................................. 7.43% 7.48% 8.64% 10.92% 14.04% (11.95)%
Efficiency ratio(5) ............................................................ 56.21% 52.29% 54.44% 57.42% 56.96% (0.26)%
Allowance as a % of loans held for investment ............... 4.55% 4.48% 2.91% 2.26% 2.99% 8.76%
Managed Metrics(1) (8):
Revenue margin .............................................................. 9.05% 9.39% 9.85% 10.66% 12.45% (6.18)%
N
et interest margin .......................................................... 6.50% 6.37% 6.46% 6.88% 7.80% (3.58)%
Risk adjusted margin ....................................................... 4.53% 5.81% 7.40% 8.23% 8.76% (12.36)%
Delinquency rate ............................................................. 4.73% 4.49% 3.87% 3.02% 3.24% 7.86%
N
et charge-off rate .......................................................... 5.87% 4.35% 2.88% 2.84% 4.25% 6.67%
Return on average assets ................................................. 0.46% 0.04% 1.33% 1.70% 1.72% (23.19)%
N
on-interest expense as a % of average loans held for
investment(5) .............................................................. 5.17% 5.01% 5.58% 6.24% 6.71% (5.08)%
Efficiency ratio(5) ............................................................ 43.35% 43.14% 47.30% 50.17% 46.81% (1.52)%
Average loans held for investment .................................. $ 143,514.4 $ 147,812.3 $ 144,727.0 $ 111,328.6 $ 85,265.0 10.97%
Average earning assets .................................................... $ 185,958.7 $ 179,348.1 $ 170,496.1 $ 129,812.8 $ 98,097.2 13.65%
Year-end loans held for investment ................................. $ 136,802.9 $ 146,936.8 $ 151,362.4 $ 146,151.3 $105,527.5 5.33%
Year-end total loan accounts ........................................... 37.8 45.4 49.1 50.0 49.7 (5.33)%
(1) Based on continuing operations.
(2) On November 16, 2005, the Company acquired 100% of the outstanding common stock of Hibernia Corporation for total
consideration of $5.0 billion.
(3) On December 1, 2006, the Company acquired 100% of the outstanding common stock of North Fork Bancorporation for total
consideration of $13.2 billion.
(4) Discontinued operations related to the shutdown of mortgage origination operations of GreenPoint Mortgage’s (“GreenPoint”)
wholesale mortgage banking unit in 2007.
(5) Excludes restructuring expenses and goodwill impairment charges.
(6) In 2008 the Company recorded impairment of goodwill in its Auto Finance business of $810.9 million.
(7) Effective February 27, 2009 the Company acquired Chevy Chase Bank, FSB for $475.9 million, which included a cash payment
of $445.0 million and an issuance of 2.6 million shares valued at $30.9 million.
(8) The Company’s “managed” consolidated financial statements reflect adjustments made related to effects of securitization
transactions qualifying as sales under GAAP. Refer to Section “IV Reconciliation to GAAP Financial Measures and
“Managed” View Information” for additional information.
(9) The 2009 and 2008 net income (loss) available to common shareholders reflects the impact of participating in the TARP
program. Refer to “Note 13 – Shareholders’ Equity, Other Comprehensive Income and Earnings per Common Share” for further
details.