Capital One 2009 Annual Report Download - page 176
Download and view the complete annual report
Please find page 176 of the 2009 Capital One annual report below. You can navigate through the pages in the report by either clicking on the pages listed below, or by using the keyword search tool below to find specific information within the annual report.-
 1
1 -
2
-
3
-
4
-
5
-
6
-
7
-
8
-
9
-
10
-
11
-
12
-
13
-
14
-
15
-
16
-
17
-
18
-
19
-
20
-
21
-
22
-
23
-
24
-
25
-
26
-
27
-
28
-
29
-
30
-
31
-
32
-
33
-
34
-
35
-
36
-
37
-
38
-
39
-
40
-
41
-
42
-
43
-
44
-
45
-
46
-
47
-
48
-
49
-
50
-
51
-
52
-
53
-
54
-
55
-
56
-
57
-
58
-
59
-
60
-
61
-
62
-
63
-
64
-
65
-
66
-
67
-
68
-
69
-
70
-
71
-
72
-
73
-
74
-
75
-
76
-
77
-
78
-
79
-
80
-
81
-
82
-
83
-
84
-
85
-
86
-
87
-
88
-
89
-
90
-
91
-
92
-
93
-
94
-
95
-
96
-
97
-
98
-
99
-
100
-
101
-
102
-
103
-
104
-
105
-
106
-
107
-
108
-
109
-
110
-
111
-
112
-
113
-
114
-
115
-
116
-
117
-
118
-
119
-
120
-
121
-
122
-
123
-
124
-
125
-
126
-
127
-
128
-
129
-
130
-
131
-
132
-
133
-
134
-
135
-
136
-
137
-
138
-
139
-
140
-
141
-
142
-
143
-
144
-
145
-
146
-
147
-
148
-
149
-
150
-
151
-
152
-
153
-
154
-
155
-
156
-
157
-
158
-
159
-
160
-
161
-
162
-
163
-
164
-
165
-
 166
166 -
 167
167 -
 168
168 -
 169
169 -
 170
170 -
 171
171 -
 172
172 -
 173
173 -
 174
174 -
 175
175 -
 176
176 -
 177
177 -
 178
178 -
 179
179 -
 180
180 -
 181
181 -
 182
182 -
 183
183 -
 184
184 -
 185
185 -
 186
186 -
187
-
188
-
189
-
190
-
191
-
192
-
193
-
194
-
195
-
196
-
197
-
198
-
199
-
200
-
201
-
202
-
203
-
204
-
205
-
206
-
207
-
208
-
209
 |
 |

163
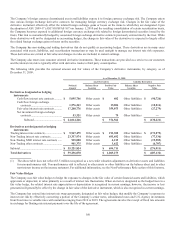
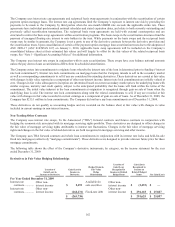
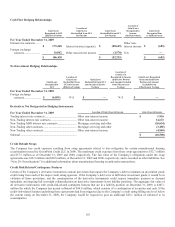
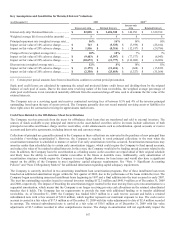
Cash Flow Hedging Relationships
Gain/(Loss)
Recognized in OCI
(Effective Portion)
Location of
Gain/(Loss)
Reclassified from OCI
into Income
Gain/(Loss)
Reclassified from OCI
into Income
Location of
Gain/(Loss)
Recognized in
Income
(Ineffectiveness)
Gain/(Loss)
Recognized Due
to Ineffectiveness
For Year Ended December 31, 2009
Interest rate contracts .......
$ 175,448 Interest income (expense) $ (88,665)
Other non-
interest income $ (685)
Foreign exchange
contracts ...................... 10,982 Other non-interest income (3,570) N/A —
$ 186,430 $ (92,235) $ (685)
Net Investment Hedging Relationships
Gain/(Loss)
Recognized in
OCI
Location of
Gain/(Loss)
Reclassified from
OCI into Income
(Effective Portion)
Gain/(Loss)
Reclassified from OCI
into Income (Effective
Portion)
Location of
Gain/(Loss)
Recognized in Income
(Ineffective Portion
and Amount Excluded
from Effectiveness
Testing)
Gain/(Loss) Recognized
in Income (Ineffective
Portion and Amount
Excluded from
Effectiveness Testing)
For Year Ended December 31, 2009
Foreign exchange
contracts ....................... $ (6,855) N/A $ — N/A $ —
Derivatives Not Designated as Hedging Instruments
For Year Ended December 31, 2009 Location of Gain (Loss) in Income Gain (Loss) in Income
Trading interest rate contracts ...........................................
.
Other non-interest income $ 1,916
N
on-Trading interest rate contracts ...................................
.
Other non-interest income 14,672
N
on-Trading MSR interest rate contracts .........................
.
Mortgage servicing and other (26,634)
N
on-Trading other contracts .............................................
.
Mortgage servicing and other (3,485)
N
on-Trading other contracts .............................................
.
Other non-interest income (4,969)
Subtotal .............................................................................
.
$ (18,500)
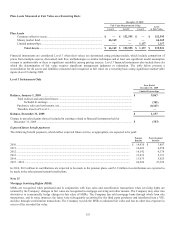
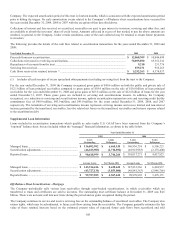
Credit Default Swaps
The Company has credit exposure resulting from swap agreements related to loss mitigation for certain manufactured housing
securitizations issued by GreenPoint Credit LLC in 2000. The maximum credit exposure from these swap agreements is $32.7 million
and $37.5 million as of December 31, 2009 and 2008, respectively. The fair value of the Company’s obligations under the swap
agreements was $18.3 million and $20.8 million, at December 31, 2009 and 2008, respectively, and is recorded as other liabilities. See
“Note 20- Securitizations” for additional information about manufactured housing securitization transactions.
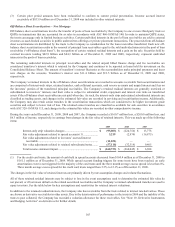
Credit Risk Related Contingency Features
Certain of the Company’s derivative instruments contain provisions that require the Company’s debt to maintain an investment grade
credit rating from each of the major credit rating agencies. If the Company’s debt were to fall below investment grade, it would be in
violation of those provisions, and the counterparties of the derivative instruments could request immediate payment or demand
immediate and ongoing full overnight collateralization on derivative instruments in net liability positions. The aggregate fair value of
all derivative instruments with credit-risk-related contingent features that are in a liability position on December 31, 2009, is $407.1
million for which the Company has posted collateral of $94.8 million, which consists of a combination of securities and cash. If the
credit-risk-related features underlying these agreements had been triggered due to the Company’s credit rating falling one level below
the current rating on December 31, 2009, the Company would be required to post an additional $28.1 million of collateral to its
counterparties.