Capital One 2009 Annual Report Download - page 141
Download and view the complete annual report
Please find page 141 of the 2009 Capital One annual report below. You can navigate through the pages in the report by either clicking on the pages listed below, or by using the keyword search tool below to find specific information within the annual report.-
 1
1 -
2
-
3
-
4
-
5
-
6
-
7
-
8
-
9
-
10
-
11
-
12
-
13
-
14
-
15
-
16
-
17
-
18
-
19
-
20
-
21
-
22
-
23
-
24
-
25
-
26
-
27
-
28
-
29
-
30
-
31
-
32
-
33
-
34
-
35
-
36
-
37
-
38
-
39
-
40
-
41
-
42
-
43
-
44
-
45
-
46
-
47
-
48
-
49
-
50
-
51
-
52
-
53
-
54
-
55
-
56
-
57
-
58
-
59
-
60
-
61
-
62
-
63
-
64
-
65
-
66
-
67
-
68
-
69
-
70
-
71
-
72
-
73
-
74
-
75
-
76
-
77
-
78
-
79
-
80
-
81
-
82
-
83
-
84
-
85
-
86
-
87
-
88
-
89
-
90
-
91
-
92
-
93
-
94
-
95
-
96
-
97
-
98
-
99
-
100
-
101
-
102
-
103
-
104
-
105
-
106
-
107
-
108
-
109
-
110
-
111
-
112
-
113
-
114
-
115
-
116
-
117
-
118
-
119
-
120
-
121
-
122
-
123
-
124
-
125
-
126
-
127
-
128
-
129
-
130
-
 131
131 -
 132
132 -
 133
133 -
 134
134 -
 135
135 -
 136
136 -
 137
137 -
 138
138 -
 139
139 -
 140
140 -
 141
141 -
 142
142 -
 143
143 -
 144
144 -
 145
145 -
 146
146 -
 147
147 -
 148
148 -
 149
149 -
 150
150 -
 151
151 -
152
-
153
-
154
-
155
-
156
-
157
-
158
-
159
-
160
-
161
-
162
-
163
-
164
-
165
-
166
-
167
-
168
-
169
-
170
-
171
-
172
-
173
-
174
-
175
-
176
-
177
-
178
-
179
-
180
-
181
-
182
-
183
-
184
-
185
-
186
-
187
-
188
-
189
-
190
-
191
-
192
-
193
-
194
-
195
-
196
-
197
-
198
-
199
-
200
-
201
-
202
-
203
-
204
-
205
-
206
-
207
-
208
-
209
 |
 |

128
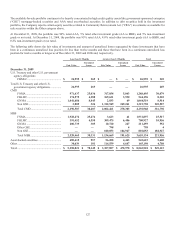
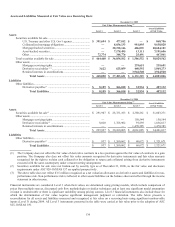
Less than 12 Months Greater than 12 Months Total
Fair Value
Unrealized
Losses Fair Value Unrealized
Losses Fair Value
Unrealized
Losses
December 31, 2008
U.S. Treasury and other U.S.
government agency obligations
FHMLC ......................................
.
$ — $ — $ 30,097 $ 821 $ 30,097 $ 821
Other GSE and DGP ..................
.
179,728 272 — — 179,728 272
Total U.S. Treasury and other U.S.
government agency obligations ......
.
179,728 272 30,097 821 209,825 1,093
CMO
FNMA ........................................
.
266,344 8,125 367,472 13,574 633,816 21,699
FHMLC ......................................
.
307,667 2,445 729,283 25,406 1,036,950 27,851
GNMA .......................................
.
— — 11,159 224 11,159 224
Non GSE ....................................
.
1,652,139 523,952 265,608 80,354 1,917,747 604,306
Total CMO .................................
.
2,226,150 534,522 1,373,522 119,558 3,599,672 654,080
MBS
FNMA ........................................
.
982,232 10,782 160,456 818 1,142,688 11,600
FHLMC ......................................
.
721,443 20,671 155,234 3,385 876,677 24,056
GNMA .......................................
.
24,876 957 7,108 163 31,984 1,120
Other GSE ..................................
.
1,389 14 — — 1,389 14
Non GSE ....................................
.
668,837 349,753 158,870 81,183 827,707 430,936
Total MBS..................................
.
2,398,777 382,177 481,668 85,549 2,880,445 467,726
Asset-backed securities .......................
.
2,660,798 194,024 692,928 145,470 3,353,726 339,494
Other ....................................................
.
107,126 2,705 120,183 16,530 227,309 19,235
Total ....................................................
.
$ 7,572,579 $ 1,113,700 $ 2,698,398 $ 367,928 $ 10,270,977 $ 1,481,628
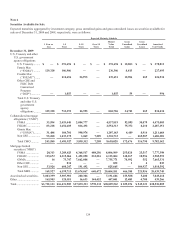
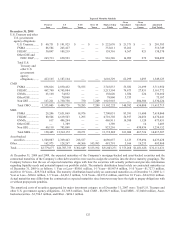
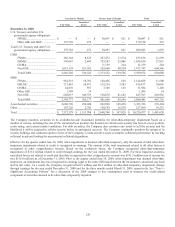
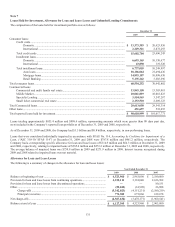
The Company monitors securities in its available-for-sale investment portfolio for other-than-temporary impairment based on a
number of criteria, including the size of the unrealized loss position, the duration for which each security has been in a loss position,
credit rating, and current market conditions. For debt securities, the Company also considers any intent to sell the security and the
likelihood it will be required to sell the security before its anticipated recovery. The Company continually monitors the ratings of its
security holdings and conducts regular reviews of the Company’s credit-sensitive assets to monitor collateral performance by tracking
collateral trends and looking for any potential collateral degradation.
Effective for the quarter ended June 30, 2009, when impairment is deemed other-than-temporary, only the amount of total other-than-
temporary impairment related to credit is recognized in earnings. The amount of the total impairment related to all other factors is
recognized in other comprehensive income. Based on the evaluation above, the Company recognized other-than-temporary
impairment of $31.6 million related to credit through earnings for the year ended December 31, 2009. For these impaired securities,
unrealized losses not related to credit and therefore recognized in other comprehensive income was $181.3 million (net of income tax
was $116.8 million) as of December 31, 2009. Prior to the quarter ended June 30, 2009, when impairment was deemed other-than-
temporary, an impairment loss was recognized in earnings equal to the entire difference between the investment’s amortized cost basis
and its fair value. As a result, the Company recognized $10.9 million and $0.4 million of other-than-temporary impairment charges
through earnings for the year ended December 31, 2008 and for the three months ended March 31, 2009, respectively. See “Note 1-
Significant Accounting Policies” for a discussion of the 2009 changes to key assumptions used to measure the credit-related
component of securities deemed to be other-than-temporarily impaired.