Capital One 2009 Annual Report Download - page 102
Download and view the complete annual report
Please find page 102 of the 2009 Capital One annual report below. You can navigate through the pages in the report by either clicking on the pages listed below, or by using the keyword search tool below to find specific information within the annual report.-
 1
1 -
2
-
3
-
4
-
5
-
6
-
7
-
8
-
9
-
10
-
11
-
12
-
13
-
14
-
15
-
16
-
17
-
18
-
19
-
20
-
21
-
22
-
23
-
24
-
25
-
26
-
27
-
28
-
29
-
30
-
31
-
32
-
33
-
34
-
35
-
36
-
37
-
38
-
39
-
40
-
41
-
42
-
43
-
44
-
45
-
46
-
47
-
48
-
49
-
50
-
51
-
52
-
53
-
54
-
55
-
56
-
57
-
58
-
59
-
60
-
61
-
62
-
63
-
64
-
65
-
66
-
67
-
68
-
69
-
70
-
71
-
72
-
73
-
74
-
75
-
76
-
77
-
78
-
79
-
80
-
81
-
82
-
83
-
84
-
85
-
86
-
87
-
88
-
89
-
90
-
91
-
 92
92 -
 93
93 -
 94
94 -
 95
95 -
 96
96 -
 97
97 -
 98
98 -
 99
99 -
 100
100 -
 101
101 -
 102
102 -
 103
103 -
 104
104 -
 105
105 -
 106
106 -
 107
107 -
 108
108 -
 109
109 -
 110
110 -
 111
111 -
 112
112 -
113
-
114
-
115
-
116
-
117
-
118
-
119
-
120
-
121
-
122
-
123
-
124
-
125
-
126
-
127
-
128
-
129
-
130
-
131
-
132
-
133
-
134
-
135
-
136
-
137
-
138
-
139
-
140
-
141
-
142
-
143
-
144
-
145
-
146
-
147
-
148
-
149
-
150
-
151
-
152
-
153
-
154
-
155
-
156
-
157
-
158
-
159
-
160
-
161
-
162
-
163
-
164
-
165
-
166
-
167
-
168
-
169
-
170
-
171
-
172
-
173
-
174
-
175
-
176
-
177
-
178
-
179
-
180
-
181
-
182
-
183
-
184
-
185
-
186
-
187
-
188
-
189
-
190
-
191
-
192
-
193
-
194
-
195
-
196
-
197
-
198
-
199
-
200
-
201
-
202
-
203
-
204
-
205
-
206
-
207
-
208
-
209
 |
 |

89
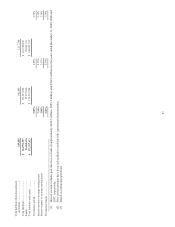
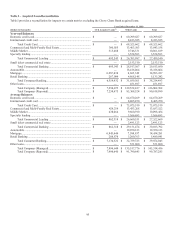
TABLE C—MANAGED LOAN PORTFOLIO
Year Ended December 31
(Dollars in thousands)
2009(2) 2008 2007 2006
2005
Year-End Balances:
Reported loans held for investment:
Consumer loans ...........................................................
Credit cards ......................................................
Domestic ................................................ $ 13,373,383 $ 20,623,950 $ 17,446,876 $ 20,211,627 $ 18,637,924
International ........................................... 2,229,321 2,872,293 3,657,034 3,206,528 3,359,471
Total credit card ..................................... $ 15,602,704 $ 23,496,243 $ 21,103,910 $ 23,418,155 $ 21,997,395
Installment loans ...............................................
Domestic ................................................ 6,693,165 10,130,677 10,474,683 7,380,910 5,726,863
International ........................................... 43,890 119,320 354,556 637,982 551,460
Total installment loans ........................... $ 6,737,055 $ 10,249,997 $ 10,829,239 $ 8,018,892 $ 6,278,323
Auto loans ................................................................... 18,186,064 21,494,436 25,017,904 21,283,004 15,255,258
Mortgage loans ............................................................ 14,893,187 10,098,430 11,561,533 3,418,884 —
Retail Banking ............................................................ 5,135,242 5,603,696 5,659,411 4,482,196 —
Total consumer loans ............................................................. $ 60,554,252 $ 70,942,802 $ 74,171,997 $ 60,621,131 $ 43,530,976
Commercial loans ..................................................................
Commercial and multi-family real estate .................... 13,843,158 13,303,081 12,414,263 891,140 —
Middle Market ............................................................ 10,061,819 10,081,823 8,288,476 3,524,564 —
Specialty Lending ....................................................... 3,554,563 3,547,287 2,948,402 — —
Small ticket commercial real estate ............................. 2,153,510 2,609,123 3,396,100 — —
Total commercial loans ......................................................... $ 29,613,050 $ 29,541,314 $ 27,047,241 $ 4,415,704 $ —
Other loans
(
1
)
........................................................................ 451,697 533,655 585,789 31,475,304 16,316,705
Total reported loans held for investment ............................... $ 90,618,999 $ 101,017,771 $ 101,805,027 $ 96,512,139 $ 59,847,681
Securitization adjustments:
Consumer loans ...........................................................
Credit cards ......................................................
Domestic ................................................ 39,827,572 39,254,153 39,832,922 38,364,776 35,200,448
International ........................................... 5,950,624 5,729,029 7,645,332 7,906,309 6,740,949
Total credit card ..................................... $ 45,778,196 $ 44,983,182 $ 47,478,254 $ 46,271,085 $ 41,941,397
Installment loans – Domestic............................ 405,707 935,801 1,968,688 2,899,221 2,621,652
Auto loans ................................................................... — — 110,448 468,823 1,116,761
Total consumer loans ............................................................. $ 46,183,903 $ 45,918,983 $ 49,557,390 $ 49,639,129 $ 45,679,810
Total securitization adjustments ............................................ $ 46,183,903 $ 45,918,983 $ 49,557,390 $ 49,639,129 $ 45,679,810
Managed loans held for investment:
Consumer loans ...........................................................
Credit cards ......................................................
Domestic ................................................ 53,200,955 59,878,103 57,279,798 58,576,403 53,838,372
International ........................................... 8,179,945 8,601,322 11,302,366 11,112,837 10,100,420
Total credit card ..................................... $ 61,380,900 $ 68,479,425 $ 68,582,164 $ 69,689,240 $ 63,938,792
Installment loans ...............................................
Domestic ................................................ 7,098,872 11,066,478 12,443,371 10,280,131 8,348,515
International ........................................... 43,890 119,320 354,556 637,982 551,460
Total installment loans ........................... $ 7,142,762 $ 11,185,798 $ 12,797,927 $ 10,918,113 $ 8,899,975
Auto loans ................................................................... 18,186,064 21,494,436 25,128,352 21,751,827 16,372,019
Mortgage loans ............................................................ 14,893,187 10,098,430 11,561,533 3,418,884 —
Retail Banking ............................................................ 5,135,242 5,603,696 5,659,411 4,482,196 —
Total consumer loans ............................................................. $ 106,738,155 $ 116,861,785 $ 123,729,387 $ 110,260,260 $ 89,210,786
Commercial loans
Commercial and multi-family real estate .................... 13,843,158 13,303,081 12,414,263 891,140 —
Middle Market ............................................................ 10,061,819 10,081,823 8,288,476 3,524,564 —
Specialty Lending ....................................................... 3,554,563 3,547,287 2,948,402 — —
Small ticket commercial real estate ............................. 2,153,510 2,609,123 3,396,100 — —
Total commercial loans ......................................................... $ 29,613,050 $ 29,541,314 $ 27,047,241 $ 4,415,704 $ —
Other loans
(
1
)
........................................................................ 451,697 533,655 585,789 31,475,304 16,316,705
Total managed loans held for investment .............................. $ 136,802,902 $ 146,936,754 $ 151,362,417 $ 146,151,268 $ 105,527,491