Capital One 2009 Annual Report Download - page 165
Download and view the complete annual report
Please find page 165 of the 2009 Capital One annual report below. You can navigate through the pages in the report by either clicking on the pages listed below, or by using the keyword search tool below to find specific information within the annual report.-
 1
1 -
2
-
3
-
4
-
5
-
6
-
7
-
8
-
9
-
10
-
11
-
12
-
13
-
14
-
15
-
16
-
17
-
18
-
19
-
20
-
21
-
22
-
23
-
24
-
25
-
26
-
27
-
28
-
29
-
30
-
31
-
32
-
33
-
34
-
35
-
36
-
37
-
38
-
39
-
40
-
41
-
42
-
43
-
44
-
45
-
46
-
47
-
48
-
49
-
50
-
51
-
52
-
53
-
54
-
55
-
56
-
57
-
58
-
59
-
60
-
61
-
62
-
63
-
64
-
65
-
66
-
67
-
68
-
69
-
70
-
71
-
72
-
73
-
74
-
75
-
76
-
77
-
78
-
79
-
80
-
81
-
82
-
83
-
84
-
85
-
86
-
87
-
88
-
89
-
90
-
91
-
92
-
93
-
94
-
95
-
96
-
97
-
98
-
99
-
100
-
101
-
102
-
103
-
104
-
105
-
106
-
107
-
108
-
109
-
110
-
111
-
112
-
113
-
114
-
115
-
116
-
117
-
118
-
119
-
120
-
121
-
122
-
123
-
124
-
125
-
126
-
127
-
128
-
129
-
130
-
131
-
132
-
133
-
134
-
135
-
136
-
137
-
138
-
139
-
140
-
141
-
142
-
143
-
144
-
145
-
146
-
147
-
148
-
149
-
150
-
151
-
152
-
153
-
154
-
 155
155 -
 156
156 -
 157
157 -
 158
158 -
 159
159 -
 160
160 -
 161
161 -
 162
162 -
 163
163 -
 164
164 -
 165
165 -
 166
166 -
 167
167 -
 168
168 -
 169
169 -
 170
170 -
 171
171 -
 172
172 -
 173
173 -
 174
174 -
 175
175 -
176
-
177
-
178
-
179
-
180
-
181
-
182
-
183
-
184
-
185
-
186
-
187
-
188
-
189
-
190
-
191
-
192
-
193
-
194
-
195
-
196
-
197
-
198
-
199
-
200
-
201
-
202
-
203
-
204
-
205
-
206
-
207
-
208
-
209
 |
 |

152
Assumed health care trend rates have a significant effect on the amounts reported for the other postretirement benefit plans. A one-
percentage point change in assumed health care cost trend rates would have the following effects:
2009 2008
1% Increase 1% Decrease 1% Increase
1% Decrease
Effect on year-end postretirement benefit obligation ................................ $ 6,490 $ (5,465) $ 7,752 $ (6,533)
Effect on total service and interest cost components ................................ $ 743 $ (609) $ 698 $ (579)
Plan Assets
The qualified defined benefit pension plan asset allocations as of the annual measurement dates are as follows:
2009 2008
Common collective trusts(1) ................................................................................................................................... 69.4% 67.0%
Money market fund ............................................................................................................................................... 30.1% 28.0%
Limited partnerships .............................................................................................................................................. 0.5% 5.0%
Total ....................................................................................................................................................................... 100.0% 100.0%
(1) Common collective trusts include domestic and international equity securities
The investment guidelines provide the following asset allocation targets and ranges: domestic equity target of 50% and allowable
range of 45% to 55%, international equity target of 20% and allowable range of 15% to 25%, and fixed income securities target of
30% and allowable range of 25% to 40%.
Plan assets are invested using a total return investment approach whereby a mix of equity securities and debt securities are used to
preserve asset values, diversify risk and enhance our ability to achieve our long term investment return benchmark. Investment
strategies and asset allocations are based on careful consideration of plan liabilities, the plan’s funded status and our financial
condition. Investment performance and asset allocation are measured and monitored on a quarterly basis.
Plan assets are managed in a balanced portfolio comprised of three major components: a domestic equity portion an international
equity portion and a domestic fixed income portion. The expected role of plan equity investments is to maximize the long-term real
growth of fund assets, while the role of fixed income investments is to generate current income, provide for more stable periodic
returns and provide some protection against a prolonged decline in the market value of fund equity investments.
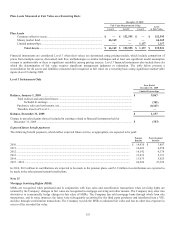
Fair Values Measurement
ASC 820-10/SFAS 157 defines fair value as the exchange price that would be received for an asset or paid to transfer a liability (an
exit price) in the principal or most advantageous market for the asset or liability in an orderly transaction between market participants
on the measurement date. ASC 820-10/SFAS 157 requires that valuation techniques maximize the use of observable inputs and
minimize the use of unobservable inputs. ASC 820-10/SFAS 157 also establishes a fair value hierarchy which prioritizes the valuation
inputs into three broad levels. Based on the underlying inputs, each fair value measurement in its entirety is reported in one of the
three levels. These levels are:
• Level 1 – Valuation is based upon quoted prices for identical instruments traded in active markets. Level 1 assets and
liabilities include debt and equity securities traded in an active exchange market, as well as U.S. Treasury securities.
• Level 2 – Valuation is based upon quoted prices for similar instruments in active markets, quoted prices for identical or
similar instruments in markets that are not active, and model based valuation techniques for which all significant
assumptions are observable in the market or can be corroborated by observable market data for substantially the full term
of the assets or liabilities.
• Level 3 – Valuation is determined using model-based techniques with significant assumptions not observable in the
market. These unobservable assumptions reflect the Company’s own estimates of assumptions that market participants
would use in pricing the asset or liability. Valuation techniques include the use of third party pricing services, option
pricing models, discounted cash flow models and similar techniques.