Capital One 2009 Annual Report Download - page 63
Download and view the complete annual report
Please find page 63 of the 2009 Capital One annual report below. You can navigate through the pages in the report by either clicking on the pages listed below, or by using the keyword search tool below to find specific information within the annual report.-
 1
1 -
2
-
3
-
4
-
5
-
6
-
7
-
8
-
9
-
10
-
11
-
12
-
13
-
14
-
15
-
16
-
17
-
18
-
19
-
20
-
21
-
22
-
23
-
24
-
25
-
26
-
27
-
28
-
29
-
30
-
31
-
32
-
33
-
34
-
35
-
36
-
37
-
38
-
39
-
40
-
41
-
42
-
43
-
44
-
45
-
46
-
47
-
48
-
49
-
50
-
51
-
52
-
 53
53 -
 54
54 -
 55
55 -
 56
56 -
 57
57 -
 58
58 -
 59
59 -
 60
60 -
 61
61 -
 62
62 -
 63
63 -
 64
64 -
 65
65 -
 66
66 -
 67
67 -
 68
68 -
 69
69 -
 70
70 -
 71
71 -
 72
72 -
 73
73 -
74
-
75
-
76
-
77
-
78
-
79
-
80
-
81
-
82
-
83
-
84
-
85
-
86
-
87
-
88
-
89
-
90
-
91
-
92
-
93
-
94
-
95
-
96
-
97
-
98
-
99
-
100
-
101
-
102
-
103
-
104
-
105
-
106
-
107
-
108
-
109
-
110
-
111
-
112
-
113
-
114
-
115
-
116
-
117
-
118
-
119
-
120
-
121
-
122
-
123
-
124
-
125
-
126
-
127
-
128
-
129
-
130
-
131
-
132
-
133
-
134
-
135
-
136
-
137
-
138
-
139
-
140
-
141
-
142
-
143
-
144
-
145
-
146
-
147
-
148
-
149
-
150
-
151
-
152
-
153
-
154
-
155
-
156
-
157
-
158
-
159
-
160
-
161
-
162
-
163
-
164
-
165
-
166
-
167
-
168
-
169
-
170
-
171
-
172
-
173
-
174
-
175
-
176
-
177
-
178
-
179
-
180
-
181
-
182
-
183
-
184
-
185
-
186
-
187
-
188
-
189
-
190
-
191
-
192
-
193
-
194
-
195
-
196
-
197
-
198
-
199
-
200
-
201
-
202
-
203
-
204
-
205
-
206
-
207
-
208
-
209
 |
 |

50
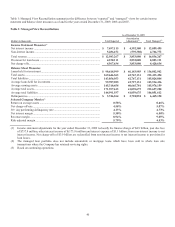
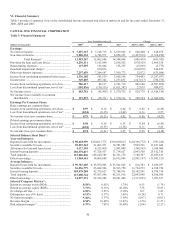
VI. Financial Summary
Table 3 provides a summary view of the consolidated income statement and selected metrics at and for the years ended December 31,
2009, 2008 and 2007.
CAPITAL ONE FINANCIAL CORPORATION
Table 3: Financial Summary
Year Ended December 31, Change
(Dollars in thousands) 2009(6) 2008 2007 2009 vs. 2008
2008 vs. 2007
Earnings:
N
et interest income .................................................... $ 7,697,115 $ 7,148,715 $ 6,529,845 $ 548,400 $ 618,870
N
on-interest income ................................................... 5,286,152 6,743,971 8,054,223 (1,457,819) (1,310,252)
Total Revenue(1) ...................................... 12,983,267 13,892,686 14,584,068 (909,419) (691,382)
Provision for loan and lease losses ............................ 4,230,111 5,101,040 2,636,502
(870,929) 2,464,538
Restructuring expenses .............................................. 119,395 134,464 138,237 (15,069) (3,773)
Goodwill impairment charge(5) .................................. — 810,876 — (810,876) 810,876
Other non-interest expenses ....................................... 7,297,659 7,264,687 7,939,773
32,972 (675,086)
Income from continuing operations before taxes ....... 1,336,102 581,619 3,869,556 754,483 (3,287,937)
Income taxes .............................................................. 349,485 497,102 1,277,837
(147,617) (780,735)
Income from continuing operations, net of tax .......... 986,617 84,517 2,591,719 902,100 (2,507,202)
Loss from discontinued operations, net of tax(3) ........ (102,836) (130,515) (1,021,387) 27,679 890,872
N
et income (loss) ....................................................... $ 883,781 $ (45,998) $ 1,570,332 $ 929,779 $ (1,616,330)
N
et income (loss) available to common
shareholders .......................................................... $ 319,873 $ (78,721) $ 1,570,332 $ 398,594 $ (1,649,053)
Earnings Per Common Share:
Basic earnings per common share:
Income from continuing operations, net of tax .......... $ 0.99 $ 0.14 $ 6.64 $ 0.85 $ (6.50)
Loss from discontinued operations, net of tax(3) ........ (0.24) (0.35) (2.62) 0.11 2.27
N
et income (loss) per common share ......................... $ 0.75 $ (0.21) $ 4.02 $ 0.96 $ (4.23)
Diluted earnings per common share:
Income from continuing operations, net of tax .......... $ 0.98 $ 0.14 $ 6.55 $ 0.84 $ (6.41)
Loss from discontinued operations, net of tax(3) ........ (0.24) (0.35) (2.58) 0.11 2.23
N
et income (loss) per common share ......................... $ 0.74 $ (0.21) $ 3.97 $ 0.95 $ (4.18)
Selected Balance Sheet Data(2) :
Year-end balances:
Reported loans held for investment............................ $ 90,618,999 $101,017,771 $101,805,027 $ (10,398,772) $ (787,256)
Securities available for sale........................................ 38,829,562 31,003,271 19,781,587 7,829,291 11,221,684
Allowance for loan and lease losses .......................... 4,127,395 4,523,960 2,963,000
(396,565) 1,560,960
Interest bearing deposits ............................................ 102,370,437 97,326,937 71,714,627 5,043,500 25,612,310
Total deposits ............................................................. 115,809,096 108,620,789 82,761,176 7,188,307 25,859,613
Other borrowings ....................................................... 11,968,461 14,869,648 26,812,969 (2,901,187) (11,943,321)
Average balances:
Reported loans held for investment............................ $ 99,787,285 $ 98,970,903 $ 93,541,825 $ 816,383 $ 5,429,077
Securities available for sale........................................ 36,836,779 25,042,506 18,933,750 11,794,273 6,108,756
Interest bearing deposits ............................................ 103,078,208 82,735,627 73,764,911 20,342,581 8,970,716
Total deposits ............................................................. 115,600,744 93,507,646 85,211,616 22,093,098 8,296,030
Other borrowings ....................................................... 14,897,331 22,214,986 20,261,449 (7,317,655) 1,953,537
Selected Company Metrics(2) :
Return on average assets (ROA) ................................ 0.58% 0.05% 1.79% 0.53 (1.74 )
Return on average equity (ROE) ................................ 3.71% 0.33% 10.28% 3.38 (9.95 )
N
et charge-off rate ..................................................... 4.58% 3.51% 2.10% 1.07 1.41
Delinquency rate (30+ days) ...................................... 4.13% 4.37% 3.66% (0.24 ) 0.71
N
et interest margin ..................................................... 5.30% 5.37% 5.38% (0.07 ) (0.01 )
Revenue margin ......................................................... 8.94% 10.44% 12.01% (1.50 ) (1.57 )
Risk adjusted margin (4) ............................................. 5.79% 7.83% 10.40% (2.04 ) (2.57 )