Capital One 2009 Annual Report Download - page 130
Download and view the complete annual report
Please find page 130 of the 2009 Capital One annual report below. You can navigate through the pages in the report by either clicking on the pages listed below, or by using the keyword search tool below to find specific information within the annual report.-
 1
1 -
2
-
3
-
4
-
5
-
6
-
7
-
8
-
9
-
10
-
11
-
12
-
13
-
14
-
15
-
16
-
17
-
18
-
19
-
20
-
21
-
22
-
23
-
24
-
25
-
26
-
27
-
28
-
29
-
30
-
31
-
32
-
33
-
34
-
35
-
36
-
37
-
38
-
39
-
40
-
41
-
42
-
43
-
44
-
45
-
46
-
47
-
48
-
49
-
50
-
51
-
52
-
53
-
54
-
55
-
56
-
57
-
58
-
59
-
60
-
61
-
62
-
63
-
64
-
65
-
66
-
67
-
68
-
69
-
70
-
71
-
72
-
73
-
74
-
75
-
76
-
77
-
78
-
79
-
80
-
81
-
82
-
83
-
84
-
85
-
86
-
87
-
88
-
89
-
90
-
91
-
92
-
93
-
94
-
95
-
96
-
97
-
98
-
99
-
100
-
101
-
102
-
103
-
104
-
105
-
106
-
107
-
108
-
109
-
110
-
111
-
112
-
113
-
114
-
115
-
116
-
117
-
118
-
119
-
 120
120 -
 121
121 -
 122
122 -
 123
123 -
 124
124 -
 125
125 -
 126
126 -
 127
127 -
 128
128 -
 129
129 -
 130
130 -
 131
131 -
 132
132 -
 133
133 -
 134
134 -
 135
135 -
 136
136 -
 137
137 -
 138
138 -
 139
139 -
 140
140 -
141
-
142
-
143
-
144
-
145
-
146
-
147
-
148
-
149
-
150
-
151
-
152
-
153
-
154
-
155
-
156
-
157
-
158
-
159
-
160
-
161
-
162
-
163
-
164
-
165
-
166
-
167
-
168
-
169
-
170
-
171
-
172
-
173
-
174
-
175
-
176
-
177
-
178
-
179
-
180
-
181
-
182
-
183
-
184
-
185
-
186
-
187
-
188
-
189
-
190
-
191
-
192
-
193
-
194
-
195
-
196
-
197
-
198
-
199
-
200
-
201
-
202
-
203
-
204
-
205
-
206
-
207
-
208
-
209
 |
 |

117
Original
Allocation Adjustments
Final
Allocation
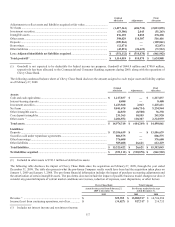
Adjustments to reflect assets and liabilities acquired at fair value: ...............................
N
et loans ....................................................................................................................... (1,427,161) (606,734) (2,033,895)
Investment securities ..................................................................................................... (53,306) 2,043 (51,263)
Intangible assets ............................................................................................................ 276,195 2,055 278,250
Other assets ................................................................................................................... 398,029 118,387 516,416
Deposits ........................................................................................................................ (109,861) — (109,861)
Borrowings ................................................................................................................... (12,871) — (12,871)
Other liabilities ............................................................................................................. (45,291) (26,621) (71,912)
Less: Adjusted identifiable net liabilities acquired .................................................. $ (351,112) $ (510,870) $ (861,982)
Total goodwill(1) ........................................................................................................... $ 1,114,018 $ 510,870 $ 1,624,888
(1) Goodwill is not expected to be deductible for federal income tax purposes. Goodwill of $844.9 million and $780.0 million,
respectively has been allocated to the Commercial and Consumer Banking segments during 2009, along with the operations of
Chevy Chase Bank.
The following condensed balance sheet of Chevy Chase Bank discloses the amount assigned to each major asset and liability caption
as of February 27, 2009.
Original
Allocation Adjustments
Final
Allocation
Assets:
Cash and cash equivalents ..........................................................................................
.
$ 1,217,837 $ — $ 1,217,837
Interest-bearing deposits .............................................................................................
.
8,480 — 8,480
Investment securities ...................................................................................................
.
1,423,568 2,043 1,425,611
N
et loans .....................................................................................................................
.
9,841,678 (606,734) 9,234,944
Other Intangible assets ................................................................................................
.
44,830 (8,500) 36,330
Core deposit intangibles ..............................................................................................
.
231,365 10,555 241,920
Other assets (1) .............................................................................................................
.
2,206,552 118,387 2,324,939
Total assets ................................................................................................................ $ 14,974,310 $ (484,249) $ 14,490,061
Liabilities:
Deposits ......................................................................................................................
.
$ 13,556,639 $ — $ 13,556,639
Securities sold under repurchase agreements ..............................................................
.
806,575 — 806,575
Other borrowings ........................................................................................................
.
376,600 — 376,600
Other liabilities ...........................................................................................................
.
585,608 26,621 612,229
Total liabilities ........................................................................................................... $ 15,325,422 $ 26,621 $ 15,352,043
Net liabilities acquired ..............................................................................................
.
$ (351,112) $ (510,870) $ (861,982)
(1) Included in other assets is $743.1 million of deferred tax assets.
The following table discloses the impact of Chevy Chase Bank since the acquisition on February 27, 2009, through the year ended
December 31, 2009. The table also presents what the pro-forma Company results would have been had the acquisition taken place on
January 1, 2009 and January 1, 2008. The pro forma financial information includes the impact of purchase accounting adjustments and
the amortization of certain intangible assets. The pro-forma does not include the impact of possible business model changes nor does it
consider any potential impacts of current market conditions on revenues, reduction of expenses, asset dispositions, or other factors.
Chevy Chase Bank Total Company
Actual for the period from February 27,
2009 to December 31, Pro-Forma results for the year
ended December 31,
2009 2009
2008
Revenue (1) .............................................................................. $ 529,355 $ 13,000,917 $ 14,706,288
Income (loss) from continuing operations, net of tax ............. $ (34,827) $ 927,317 $ 216,755
(1) Includes net interest income and non interest income.