Capital One 2009 Annual Report Download - page 112
Download and view the complete annual report
Please find page 112 of the 2009 Capital One annual report below. You can navigate through the pages in the report by either clicking on the pages listed below, or by using the keyword search tool below to find specific information within the annual report.-
 1
1 -
2
-
3
-
4
-
5
-
6
-
7
-
8
-
9
-
10
-
11
-
12
-
13
-
14
-
15
-
16
-
17
-
18
-
19
-
20
-
21
-
22
-
23
-
24
-
25
-
26
-
27
-
28
-
29
-
30
-
31
-
32
-
33
-
34
-
35
-
36
-
37
-
38
-
39
-
40
-
41
-
42
-
43
-
44
-
45
-
46
-
47
-
48
-
49
-
50
-
51
-
52
-
53
-
54
-
55
-
56
-
57
-
58
-
59
-
60
-
61
-
62
-
63
-
64
-
65
-
66
-
67
-
68
-
69
-
70
-
71
-
72
-
73
-
74
-
75
-
76
-
77
-
78
-
79
-
80
-
81
-
82
-
83
-
84
-
85
-
86
-
87
-
88
-
89
-
90
-
91
-
92
-
93
-
94
-
95
-
96
-
97
-
98
-
99
-
100
-
101
-
 102
102 -
 103
103 -
 104
104 -
 105
105 -
 106
106 -
 107
107 -
 108
108 -
 109
109 -
 110
110 -
 111
111 -
 112
112 -
 113
113 -
 114
114 -
 115
115 -
 116
116 -
 117
117 -
 118
118 -
 119
119 -
 120
120 -
 121
121 -
 122
122 -
123
-
124
-
125
-
126
-
127
-
128
-
129
-
130
-
131
-
132
-
133
-
134
-
135
-
136
-
137
-
138
-
139
-
140
-
141
-
142
-
143
-
144
-
145
-
146
-
147
-
148
-
149
-
150
-
151
-
152
-
153
-
154
-
155
-
156
-
157
-
158
-
159
-
160
-
161
-
162
-
163
-
164
-
165
-
166
-
167
-
168
-
169
-
170
-
171
-
172
-
173
-
174
-
175
-
176
-
177
-
178
-
179
-
180
-
181
-
182
-
183
-
184
-
185
-
186
-
187
-
188
-
189
-
190
-
191
-
192
-
193
-
194
-
195
-
196
-
197
-
198
-
199
-
200
-
201
-
202
-
203
-
204
-
205
-
206
-
207
-
208
-
209
 |
 |

99
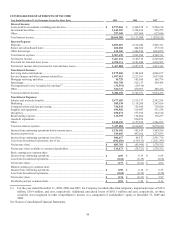
CONSOLIDATED STATEMENTS OF INCOME
Year Ended December 31 (In Thousands, Except Per Share Data)
2009 2008
2007
Interest Income:
Loans held for investment, including past-due fees ....................................................... $ 8,757,066 $ 9,460,378 $ 9,500,128
Investment Securities ..................................................................................................... 1,610,210 1,224,012 950,972
Other .............................................................................................................................. 297,309 427,609 627,056
Total interest income ..................................................................................................... 10,664,585 11,111,999 11,078,156
Interest Expense:
Deposits ......................................................................................................................... 2,093,019 2,512,040 2,906,351
Senior and subordinated notes ....................................................................................... 260,282 444,854 577,128
Other borrowings ........................................................................................................... 614,169 1,006,390 1,064,832
Total interest expense .................................................................................................... 2,967,470 3,963,284 4,548,311
N
et interest income ........................................................................................................ 7,697,115 7,148,715 6,529,845
Provision for loan and lease losses ................................................................................ 4,230,111 5,101,040 2,636,502
N
et interest income after provision for loan and lease losses ........................................ 3,467,004 2,047,675 3,893,343
Non-Interest Income:
Servicing and securitizations ......................................................................................... 2,279,826 3,384,468 4,840,677
Service charges and other customer-related fees ........................................................... 1,997,013 2,232,363 2,057,854
Mortgage servicing and other ........................................................................................ 14,729 105,038 166,776
Interchange .................................................................................................................... 501,798 562,117 500,484
N
et impairment losses recognized in earnings(1) ........................................................... (31,951) (10,916) —
Other .............................................................................................................................. 524,737 470,901 488,432
Total non-interest income .............................................................................................. 5,286,152 6,743,971 8,054,223
Non-Interest Expense:
Salaries and associate benefits ....................................................................................... 2,477,655 2,335,737 2,592,534
Marketing ...................................................................................................................... 588,338 1,118,208 1,347,836
Communications and data processing ............................................................................ 740,543 755,989 758,820
Supplies and equipment ................................................................................................. 499,582 519,687 531,238
Occupancy ..................................................................................................................... 450,871 377,192 322,510
Restructuring expense .................................................................................................... 119,395 134,464 138,237
Goodwill impairment ..................................................................................................... — 810,876 —
Other .............................................................................................................................. 2,540,670 2,157,874 2,386,835
Total non-interest expense ............................................................................................. 7,417,054 8,210,027 8,078,010
Income from continuing operations before income taxes .............................................. 1,336,102 581,619 3,869,556
Income tax provision ..................................................................................................... 349,485 497,102 1,277,837
Income from continuing operations, net of tax .............................................................. 986,617 84,517 2,591,719
Loss from discontinued operations, net of tax ............................................................... (102,836) (130,515) (1,021,387)
N
et income (loss) ........................................................................................................... $ 883,781 $ (45,998) $ 1,570,332
N
et income (loss) available to common shareholders.................................................... $ 319,873 $ (78,721) $ 1,570,332
Basic earnings per common share
Income from continuing operations ............................................................................... $ 0.99 $ 0.14 $ 6.64
Loss from discontinued operations ................................................................................ (0.24) (0.35) (2.62)
N
et income (loss) ........................................................................................................... $ 0.75 $ (0.21) $ 4.02
Diluted earnings per common share
Income from continuing operations ............................................................................... $ 0.98 $ 0.14 $ 6.55
Loss from discontinued operations ................................................................................ (0.24) (0.35) (2.58)
N
et income (loss) ........................................................................................................... $ 0.74 $ (0.21) $ 3.97
Dividends paid per common share ................................................................................. $ 0.53 $ 1.50 $ 0.11
(1) For the year ended December 31, 2009, 2008 and 2007, the Company recorded other-than-temporary impairment losses of $32.0
million, $10.9 million, and zero, respectively. Additional unrealized losses of $181.3 million and zero, respectively, on these
securities was recognized in other comprehensive income as a component of stockholders’ equity at December 31, 2009 and
2008.
See Notes to Consolidated Financial Statements.