Capital One 2009 Annual Report Download - page 65
Download and view the complete annual report
Please find page 65 of the 2009 Capital One annual report below. You can navigate through the pages in the report by either clicking on the pages listed below, or by using the keyword search tool below to find specific information within the annual report.-
 1
1 -
2
-
3
-
4
-
5
-
6
-
7
-
8
-
9
-
10
-
11
-
12
-
13
-
14
-
15
-
16
-
17
-
18
-
19
-
20
-
21
-
22
-
23
-
24
-
25
-
26
-
27
-
28
-
29
-
30
-
31
-
32
-
33
-
34
-
35
-
36
-
37
-
38
-
39
-
40
-
41
-
42
-
43
-
44
-
45
-
46
-
47
-
48
-
49
-
50
-
51
-
52
-
53
-
54
-
 55
55 -
 56
56 -
 57
57 -
 58
58 -
 59
59 -
 60
60 -
 61
61 -
 62
62 -
 63
63 -
 64
64 -
 65
65 -
 66
66 -
 67
67 -
 68
68 -
 69
69 -
 70
70 -
 71
71 -
 72
72 -
 73
73 -
 74
74 -
 75
75 -
76
-
77
-
78
-
79
-
80
-
81
-
82
-
83
-
84
-
85
-
86
-
87
-
88
-
89
-
90
-
91
-
92
-
93
-
94
-
95
-
96
-
97
-
98
-
99
-
100
-
101
-
102
-
103
-
104
-
105
-
106
-
107
-
108
-
109
-
110
-
111
-
112
-
113
-
114
-
115
-
116
-
117
-
118
-
119
-
120
-
121
-
122
-
123
-
124
-
125
-
126
-
127
-
128
-
129
-
130
-
131
-
132
-
133
-
134
-
135
-
136
-
137
-
138
-
139
-
140
-
141
-
142
-
143
-
144
-
145
-
146
-
147
-
148
-
149
-
150
-
151
-
152
-
153
-
154
-
155
-
156
-
157
-
158
-
159
-
160
-
161
-
162
-
163
-
164
-
165
-
166
-
167
-
168
-
169
-
170
-
171
-
172
-
173
-
174
-
175
-
176
-
177
-
178
-
179
-
180
-
181
-
182
-
183
-
184
-
185
-
186
-
187
-
188
-
189
-
190
-
191
-
192
-
193
-
194
-
195
-
196
-
197
-
198
-
199
-
200
-
201
-
202
-
203
-
204
-
205
-
206
-
207
-
208
-
209
 |
 |

52
Interest expense declined by $995.8 million from 2008. Approximately half of this decline occurred in our interest bearing deposits
due to a decline in average rate from 3.04% in 2008 to 2.03% during 2009. In addition the Company’s average other borrowings
declined by $7.3 billion driven by a decrease of FHLB debt and run-off of auto securitizations during 2009. The remainder of the
decrease occurred in the Company’s Senior and Subordinated notes where the Company took advantage of lower interest rates.
Average senior and subordinated rates declined to 3.02% for 2009 from 5.01% in 2008.
For the year ended December 31, 2009, reported net interest income increased 7.7%, or $548.4 million, compared to 2008. The
increase was largely driven by the decrease in deposit related expenses, maturities of outstanding notes and run-off of auto
securitizations during 2009. Net interest margin decreased slightly by 8 basis points to 5.30% for the year ended December 31, 2009.
For the year ended December 31, 2008, reported net interest income increased 9.5%, or $618.9 million. Interest income on loans held
for investment decreased modestly to $9.46 billion from $9.50 billion at the end of 2007 as the increase in average loans held for
investment from $93.5 billion to $99.0 billion was offset by the impact of increasing delinquencies which caused our revenue
suppression to increase to $1.9 billion from $1.1 billion in 2007, and by lower interest rates on our variable rate products as interest
rates declined throughout the year.
Interest income on securities available for sale increased $273.0 million driven by increases in the average portfolio from $18.9 billion
to $25.0 billion in 2008 while yields remained stable. The increase in the securities available for sale portfolio came as the Company
continued to grow its deposit base and maintained our approach of holding high quality, low risk investments rather than taking
excessive credit risk to generate incremental earnings. While interest rates declined throughout 2008, the Company maintained stable
yields in growing the securities portfolio by taking advantage of market illiquidity to purchase securities at an attractive yield.
Interest expense on interest-bearing deposits decreased $394.3 million from 2007. The average balance on interest-bearing deposits
increased to $82.7 billion from $74.0 billion while the yield decreased to 3.04% in 2008 from 3.94% as the Federal Reserve reduced
the federal funds rate throughout 2008.
For additional information, see “Table A – Statement of Average Balances, Income and Expense, Yields and Rates” and “Table B –
Interest Variance Analysis” for further details.
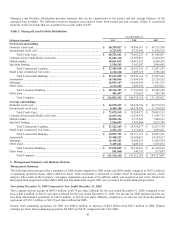
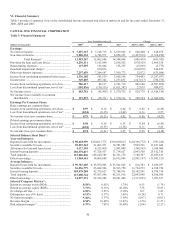
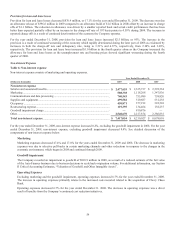
Table 5: Non-interest income
Non-Interest Income
Year Ended December 31,
(Dollars in thousands)
2009 2008
2007
Non-interest income
Servicing and securitizations .............................................................................................
.
$ 2,279,826 $ 3,384,468 $ 4,840,677
Service charges and other customer-related fees ...............................................................
.
1,997,013 2,232,363 2,057,854
Mortgage servicing and other ............................................................................................
.
14,729 105,038 166,776
Interchange ........................................................................................................................
.
501,798 562,117 500,484
N
et impair
m
ent losses recognized in earnings ..................................................................
.
(31,951) (10,916) —
Other ..................................................................................................................................
.
524,737 470,901 488,432
Total non-interest income ...............................................................................................
.
$ 5,286,152 $ 6,743,971 $ 8,054,223
Non-interest income is comprised of servicing and securitizations income, service charges and other customer-related fees, mortgage
servicing and other, interchange income and other non-interest income.
For the year ended December 31, 2009, non-interest income decreased 21.6% compared to 2008. For the year ended December 31,
2008, non-interest income decreased 16.3% compared to 2007. See detailed discussion of the components of non-interest income
below.
Servicing and Securitizations Income
Servicing and securitizations income represents servicing fees, excess spread and other fees derived from the off-balance sheet
loan portfolio, adjustments to the fair value of retained interests derived through securitization transactions, as well as gains and
losses resulting from securitization and other sales transactions.
Servicing and securitizations income decreased 32.6% for the year ended December 31, 2009. The decrease was attributable to
continuous reductions in average securitized loans and reduction in the fair value of retained interests and higher charge offs on
the securitized portfolio as a result of continued stress in the economic environment. In addition, average securitized loans
continued to decline to $43.7 billion for 2009 compared to $48.8 billion for 2008.