Capital One 2009 Annual Report Download - page 103
Download and view the complete annual report
Please find page 103 of the 2009 Capital One annual report below. You can navigate through the pages in the report by either clicking on the pages listed below, or by using the keyword search tool below to find specific information within the annual report.-
 1
1 -
2
-
3
-
4
-
5
-
6
-
7
-
8
-
9
-
10
-
11
-
12
-
13
-
14
-
15
-
16
-
17
-
18
-
19
-
20
-
21
-
22
-
23
-
24
-
25
-
26
-
27
-
28
-
29
-
30
-
31
-
32
-
33
-
34
-
35
-
36
-
37
-
38
-
39
-
40
-
41
-
42
-
43
-
44
-
45
-
46
-
47
-
48
-
49
-
50
-
51
-
52
-
53
-
54
-
55
-
56
-
57
-
58
-
59
-
60
-
61
-
62
-
63
-
64
-
65
-
66
-
67
-
68
-
69
-
70
-
71
-
72
-
73
-
74
-
75
-
76
-
77
-
78
-
79
-
80
-
81
-
82
-
83
-
84
-
85
-
86
-
87
-
88
-
89
-
90
-
91
-
92
-
 93
93 -
 94
94 -
 95
95 -
 96
96 -
 97
97 -
 98
98 -
 99
99 -
 100
100 -
 101
101 -
 102
102 -
 103
103 -
 104
104 -
 105
105 -
 106
106 -
 107
107 -
 108
108 -
 109
109 -
 110
110 -
 111
111 -
 112
112 -
 113
113 -
114
-
115
-
116
-
117
-
118
-
119
-
120
-
121
-
122
-
123
-
124
-
125
-
126
-
127
-
128
-
129
-
130
-
131
-
132
-
133
-
134
-
135
-
136
-
137
-
138
-
139
-
140
-
141
-
142
-
143
-
144
-
145
-
146
-
147
-
148
-
149
-
150
-
151
-
152
-
153
-
154
-
155
-
156
-
157
-
158
-
159
-
160
-
161
-
162
-
163
-
164
-
165
-
166
-
167
-
168
-
169
-
170
-
171
-
172
-
173
-
174
-
175
-
176
-
177
-
178
-
179
-
180
-
181
-
182
-
183
-
184
-
185
-
186
-
187
-
188
-
189
-
190
-
191
-
192
-
193
-
194
-
195
-
196
-
197
-
198
-
199
-
200
-
201
-
202
-
203
-
204
-
205
-
206
-
207
-
208
-
209
 |
 |

90
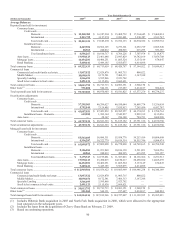
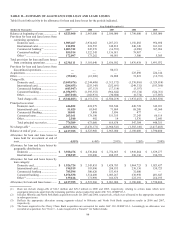
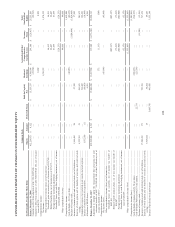
Year Ended December 31
(Dollars in thousands)
2009(2) 2008 2007(3) 2006
2005
Average Balances:
Reported loans held for investment:
Consumer loans ...........................................................
Credit cards ......................................................
Domestic ................................................ $ 18,268,382 $ 16,387,284 $ 15,408,732 $ 17,364,645 $ 15,468,014
International ........................................... 2,543,739 3,197,974 2,983,401 3,230,287 3,531,767
Total credit card ..................................... $ 20,812,121 $ 19,585,258 $ 18,392,133 $ 20,594,932 $ 18,999,781
Installment loans ...............................................
Domestic ................................................ 8,467,304 10,562,105 8,273,301 6,692,719 6,565,520
International ........................................... 68,963 248,012 490,925 615,255 553,357
Total installment loans ........................... $ 8,536,267 $ 10,810,717 $ 8,764,226 $ 7,307,974 $ 7,118,877
Auto loans ................................................................... 19,950,123 23,461,648 23,893,829 19,742,169 13,056,708
Mortgage loans ............................................................ 14,434,281 10,406,251 11,805,524 5,135,149 674,047
Retail Banking ............................................................ 5,489,641 5,449,185 5,565,075 4,414,698
Total consumer loans ............................................................. $ 69,222,433 $ 69,713,059 $ 68,420,787 $ 57,194,922 $ 39,849,413
Commercial loans
Commercial and multi-family real estate .......................
.
13,857,522 12,829,870 11,905,715 800,822 —
Middle Market ............................................................ 10,098,454 9,172,541 7,404,313 3,167,348 —
Specialty Lending ....................................................... 3,566,693 3,595,866 2,923,702 — —
Small ticket commercial real estate ............................. 2,491,123 3,115,436 2,669,621 — —
Total commercial loans ......................................................... $ 30,013,792 $ 28,713,713 $ 24,903,351 $ 3,968,170 $ —
Other loans
(
1
)
........................................................................ 551,060 544,131 217,687 2,414,187 884,824
Total reported loans held for investment ............................... $ 99,787,285 $ 98,970,903 $ 93,541,825 $ 63,577,279 $ 40,734,237
Securitization adjustments:
Consumer loans ...........................................................
Credit cards ......................................................
Domestic ................................................ 37,295,303 40,299,027 40,550,044 36,888,774 35,336,054
International ........................................... 5,792,548 7,124,805 7,835,913 7,285,459 6,452,707
Total credit card ..................................... $ 43,087,851 $ 47,423,832 $ 48,385,957 $ 44,174,233 $ 41,788,761
Installment loans – Domestic............................ 639,280 1,389,164 2,542,837 2,828,332 1,133,036
Auto loans ................................................................... — 28,367 256,388 748,751 1,608,989
Total consumer loans ............................................................. $ 43,727,131 $ 48,841,363 $ 51,185,182 $ 47,751,316 $ 44,530,786
Total securitization adjustments ............................................ $ 43,727,131 $ 48,841,363 $ 51,185,182 $ 47,751,316 $ 44,530,786
Managed loans held for investment:
Consumer loans ...........................................................
Credit cards ......................................................
Domestic ................................................ 55,563,685 56,686,311 55,958,776 54,253,419 50,804,068
International ........................................... 8,336,287 10,322,779 10,819,314 10,515,746 9,984,474
Total credit card ..................................... $ 63,899,972 $ 67,009,090 $ 66,778,090 $ 64,769,165 $ 60,788,542
Installment loans ...............................................
Domestic ................................................ 9,106,584 11,951,869 10,816,138 9,521,051 7,698,556
International ........................................... 68,963 248,012 490,925 615,255 553,357
Total installment loans ........................... $ 9,175,547 $ 12,199,881 $ 11,307,063 $ 10,136,306 $ 8,251,913
Auto loans ................................................................... 19,950,123 23,490,015 24,150,217 20,490,920 14,665,697
Mortgage loans ............................................................ 14,434,281 10,406,251 11,805,524 5,135,149 674,047
Retail Banking ............................................................ 5,489,641 5,449,185 5,565,075 4,414,698 —
Total consumer loans ............................................................. $ 112,949,564 $ 118,554,422 $ 119,605,969 $ 104,946,238 $ 84,380,199
Commercial loans
Commercial and multi-family real estate .........................
.
13,857,522 12,829,870 11,905,715 800,822 —
Middle Market ............................................................ 10,098,454 9,172,541 7,404,313 3,167,348 —
Specialty Lending ....................................................... 3,566,693 3,595,866 2,923,702 — —
Small ticket commercial real estate ............................. 2,491,123 3,115,436 2,669,621 — —
Total commercial loans ......................................................... $ 30,013,792 $ 28,713,713 $ 24,903,351 $ 3,968,170 $ —
Other loans
(
1
)
........................................................................ 551,060 544,131 217,687 2,414,187 844,824
Total managed loans held for investment .............................. $ 143,514,416 $ 147,812,266 $ 144,727,007 $ 111,328,595 $ 85,265,023
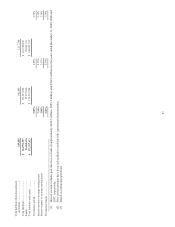
(1) Includes Hibernia Bank acquisition in 2005 and North Fork Bank acquisition in 2006, which were allocated to the appropriate
loan categories in the subsequent years.
(2) Includes the loans from the acquisition of Chevy Chase Bank on February 27, 2009.
(3) Based on continuing operations.