Capital One 2009 Annual Report Download - page 162
Download and view the complete annual report
Please find page 162 of the 2009 Capital One annual report below. You can navigate through the pages in the report by either clicking on the pages listed below, or by using the keyword search tool below to find specific information within the annual report.-
 1
1 -
2
-
3
-
4
-
5
-
6
-
7
-
8
-
9
-
10
-
11
-
12
-
13
-
14
-
15
-
16
-
17
-
18
-
19
-
20
-
21
-
22
-
23
-
24
-
25
-
26
-
27
-
28
-
29
-
30
-
31
-
32
-
33
-
34
-
35
-
36
-
37
-
38
-
39
-
40
-
41
-
42
-
43
-
44
-
45
-
46
-
47
-
48
-
49
-
50
-
51
-
52
-
53
-
54
-
55
-
56
-
57
-
58
-
59
-
60
-
61
-
62
-
63
-
64
-
65
-
66
-
67
-
68
-
69
-
70
-
71
-
72
-
73
-
74
-
75
-
76
-
77
-
78
-
79
-
80
-
81
-
82
-
83
-
84
-
85
-
86
-
87
-
88
-
89
-
90
-
91
-
92
-
93
-
94
-
95
-
96
-
97
-
98
-
99
-
100
-
101
-
102
-
103
-
104
-
105
-
106
-
107
-
108
-
109
-
110
-
111
-
112
-
113
-
114
-
115
-
116
-
117
-
118
-
119
-
120
-
121
-
122
-
123
-
124
-
125
-
126
-
127
-
128
-
129
-
130
-
131
-
132
-
133
-
134
-
135
-
136
-
137
-
138
-
139
-
140
-
141
-
142
-
143
-
144
-
145
-
146
-
147
-
148
-
149
-
150
-
151
-
 152
152 -
 153
153 -
 154
154 -
 155
155 -
 156
156 -
 157
157 -
 158
158 -
 159
159 -
 160
160 -
 161
161 -
 162
162 -
 163
163 -
 164
164 -
 165
165 -
 166
166 -
 167
167 -
 168
168 -
 169
169 -
 170
170 -
 171
171 -
 172
172 -
173
-
174
-
175
-
176
-
177
-
178
-
179
-
180
-
181
-
182
-
183
-
184
-
185
-
186
-
187
-
188
-
189
-
190
-
191
-
192
-
193
-
194
-
195
-
196
-
197
-
198
-
199
-
200
-
201
-
202
-
203
-
204
-
205
-
206
-
207
-
208
-
209
 |
 |

149
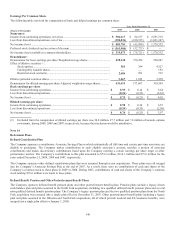
Earnings Per Common Share
The following table sets forth the computation of basic and diluted earnings per common share:
Year Ended December 31
(Shares in Thousands) 2009 2008
2007
Numerator:
Income from continuing operations, net of tax ................................................................
.
$ 986,617 $ 84,517 $ 2,591,719
Loss from discontinued operations, net of tax .................................................................
.
(102,836 ) (130,515 ) (1,021,387 )
N
et income (loss) .............................................................................................................
.
$ 883,781 $ (45,998 ) $ 1,570,332
Preferred stock dividends and accretion of discount ........................................................
.
$ (563,908 ) $ (32,723 ) $ —
N
et income (loss) available to common shareholders ......................................................
.
$ 319,873 $ (78,721 ) $ 1,570,332
Denominator:
Denominator for basic earnings per share-Weighted-average shares ..............................
.
428,148 376,282 390,287
Effect of dilutive securities (1) :
Stock options ..........................................................................................................
.
581 394 4,327
Contingently issuable shares ..................................................................................
.
— — 192
Restricted stock and units .......................................................................................
.
2,686 991 739
Dilutive potential common shares ................................................................................... 3,267 1,385 5,258
Denominator for diluted earnings per share-Adjusted weighted-average shares ............ 431,415 377,667 395,545
Basic earnings per share
Income from continuing operations ................................................................................ $ 0.99 $ 0.14 $ 6.64
Loss from discontinued operations ................................................................................. (0.24
)
(0.35 ) (2.62 )
N
et income (loss) ............................................................................................................ $ 0.75 $ (0.21 ) $ 4.02
Diluted earnings per share
Income from continuing operations ................................................................................ $ 0.98 $ 0.14 $ 6.55
Loss from discontinued operations ................................................................................. (0.24
)
(0.35 ) (2.58 )
N
et inco
m
e (loss) ............................................................................................................ $ 0.74 $ (0.21 ) $ 3.97
(1) Excluded from the computation of diluted earnings per share was 34.8 million, 27.7 million and 7.4 million of awards, options
or warrants, during 2009, 2008 and 2007, respectively, because their inclusion would be antidilutive.
Note 14
Retirement Plans
Defined Contribution Plan
The Company sponsors a contributory Associate Savings Plan in which substantially all full-time and certain part-time associates are
eligible to participate. The Company makes contributions to each eligible associate’s account, matches a portion of associate
contributions and makes discretionary contributions based upon the Company meeting a certain earnings per share target or other
performance metrics. The Company’s contributions to this plan amounted to $79.5 million, $110.3 million and $73.6 million for the
years ended December 31, 2009, 2008 and 2007, respectively.
The Company sponsors other defined contribution plans that were assumed through recent acquisitions. These plans were all merged
into the Company’s Associate Savings Plan at the end of 2007. As a result, there were no contributions of cash and shares of the
Company’s common stock to these plans in 2009 or 2008. During 2007, contributions of cash and shares of the Company’s common
stock totaling $35.6 million were made to these plans.
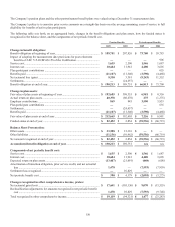
Defined Benefit Pension and Other Postretirement Benefit Plans
The Company sponsors defined benefit pension plans and other postretirement benefit plans. Pension plans include a legacy frozen
cash balance plan and plans assumed in the North Fork acquisition, including two qualified defined benefit pension plans and several
non-qualified defined benefit pension plans. The Company’s legacy pension plan and the two qualified pension plans from the North
Fork acquisition were merged into a single plan effective December 31, 2007. Other postretirement benefit plans including a legacy
plan and plans assumed in the Hibernia and North Fork acquisitions, all of which provide medical and life insurance benefits, were
merged into a single plan effective January 1, 2008.