Capital One 2009 Annual Report Download - page 84
Download and view the complete annual report
Please find page 84 of the 2009 Capital One annual report below. You can navigate through the pages in the report by either clicking on the pages listed below, or by using the keyword search tool below to find specific information within the annual report.-
 1
1 -
2
-
3
-
4
-
5
-
6
-
7
-
8
-
9
-
10
-
11
-
12
-
13
-
14
-
15
-
16
-
17
-
18
-
19
-
20
-
21
-
22
-
23
-
24
-
25
-
26
-
27
-
28
-
29
-
30
-
31
-
32
-
33
-
34
-
35
-
36
-
37
-
38
-
39
-
40
-
41
-
42
-
43
-
44
-
45
-
46
-
47
-
48
-
49
-
50
-
51
-
52
-
53
-
54
-
55
-
56
-
57
-
58
-
59
-
60
-
61
-
62
-
63
-
64
-
65
-
66
-
67
-
68
-
69
-
70
-
71
-
72
-
73
-
 74
74 -
 75
75 -
 76
76 -
 77
77 -
 78
78 -
 79
79 -
 80
80 -
 81
81 -
 82
82 -
 83
83 -
 84
84 -
 85
85 -
 86
86 -
 87
87 -
 88
88 -
 89
89 -
 90
90 -
 91
91 -
 92
92 -
 93
93 -
 94
94 -
95
-
96
-
97
-
98
-
99
-
100
-
101
-
102
-
103
-
104
-
105
-
106
-
107
-
108
-
109
-
110
-
111
-
112
-
113
-
114
-
115
-
116
-
117
-
118
-
119
-
120
-
121
-
122
-
123
-
124
-
125
-
126
-
127
-
128
-
129
-
130
-
131
-
132
-
133
-
134
-
135
-
136
-
137
-
138
-
139
-
140
-
141
-
142
-
143
-
144
-
145
-
146
-
147
-
148
-
149
-
150
-
151
-
152
-
153
-
154
-
155
-
156
-
157
-
158
-
159
-
160
-
161
-
162
-
163
-
164
-
165
-
166
-
167
-
168
-
169
-
170
-
171
-
172
-
173
-
174
-
175
-
176
-
177
-
178
-
179
-
180
-
181
-
182
-
183
-
184
-
185
-
186
-
187
-
188
-
189
-
190
-
191
-
192
-
193
-
194
-
195
-
196
-
197
-
198
-
199
-
200
-
201
-
202
-
203
-
204
-
205
-
206
-
207
-
208
-
209
 |
 |
71
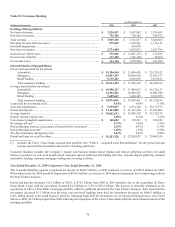
Total revenue from the prior year decreased from $12.1 billion to $11.3 billion. Net interest income was slightly higher, increasing
$79.0 million to $7.5 billion. Non-interest income was down by $931.6 million or 19.9% to $3.7 billion. In Domestic Card, total
revenue was down by $621.7 million to $10.0 billion from 2008 to 2009. Net interest income increased $178.0 million or 2.7% to $6.7
billion. Higher interest margins in the revolving credit line of business more than offset the lost interest income from declining loan
balances. Non-interest income was down by $799.8 million or 19.4% to $3.3 billion. The lower number of loan accounts on file and
lower purchase volume negatively impacted non-interest income. Additionally, the economic environment caused customers to behave
defensively resulting in lower overlimit and past due fees. For International Card, total revenue in 2009 was $1.3 billion, $230.9
million or 15.2% lower than 2008. Over $190 million of the decline was due to exchange rate movements. The remainder of the
decline is primarily from lower non-interest income from fewer accounts on file.
Net adjusted charge-offs increased by $1.7 billion or 34.9% from 2008 to 2009. The net adjusted charge off rate increased from 6.26%
to 9.15%. The allowance for loan losses experienced a release in 2009 due to a reduction in loans. The combination of the net adjusted
charge-offs and the allowance release resulted in the net provision for loan losses decreasing slightly to $6.1 billion, a $56.5 million or
a 0.9% decrease. On the Domestic Card side, the continued negative external credit environment caused net adjusted charge-offs to
increase by $1.6 billion or 36.8% from 2008 to 2009. The allowance for loan losses had a release during the year of $617.1 million
versus a build of $1.1 billion in 2008. The release was primarily driven by the shrinking reported loan book. The increase in net
adjusted charge offs and release of allowance resulted in a $5.3 billion net provision for loan losses in 2009, a decrease of $132.0
million or 2.4% over 2008. International Card experienced an increase in net adjusted charge offs of $132.1 million or 21.7% to
$742.3 million from 2008 to 2009. The underlying change, with no foreign exchange rate movements, reveals that charge offs would
have gone up $211.2 million. The weak economy in both Canada and the U.K. are driving the increase. In 2009, the allowance for
loan losses experienced a small release of $19.8 million versus a build of $37.8 million in 2008. The release was mainly due to lower
loan volumes. This release somewhat offset the increase in net adjusted charge offs resulting in the net provision for loan losses
increasing by $75.5 million or 11.7% to $722.5 million.
Non-interest expense was $3.7 billion for 2009 which is a decline of $654.7 million or 14.9% from 2008. In Domestic Card, 2009
non-interest expense declined by $366.9 million or 10.1% from 2008 to $3.3 billion, driven by pullbacks in both new account
marketing and customer management marketing in light of the current economic environment. International Card non-interest expense
declined by $287.9 million or 37.4% from 2008 to 2009 to $482.3 million. Exchange rate movement drove almost $101.0 million of
the decline. Similar to the domestic side, expenses have gone down due to pullbacks in marketing. In addition, the U.K. has driven
down their operating costs through increased operating efficiencies.
Year Ended December 31, 2008 Compared to Year Ended December 31, 2007
For the year ended December 31, 2008, the Credit Card segment recognized net income of $1.1 billion, compared to net income of
$2.4 billion for 2007. For the year, Domestic Card’s net income was $998.3 million, compared to $2.3 billion net income in 2007.
Increased loan loss provision drove the decrease in net income. International Card net income was $68.7 million for the year,
compared to $139.9 million in 2007. Exchange rate movements impacted the reported U.S. Dollar numbers. From year end 2007 to
year end 2008, the Pound Sterling fell 27.0% and the Canadian Dollar fell 19.5% against the U.S. Dollar. However, the average
exchange rate movement between 2007 and 2008 saw the Pound Sterling fall 7.3% and the Canadian Dollar was flat to the U.S.
Dollar. Without the exchange rate movements, International Card net income would have been $75.7 million.
The loan portfolio decreased by $1.7 billion or 2.1% to $79.7 billion from December 31, 2007 to December 31, 2008. Of this total,
Domestic Card increased $1.2 billion while International Card decreased $2.9 billion. International Card loans would have stayed flat
from year to year if the Pound Sterling and Canadian Dollar did not decline against the U.S. Dollar as discussed above. The Domestic
Card loan portfolio increased by $1.2 billion or 1.8% to $70.9 billion from December 31, 2007 to December 31, 2008. Modest growth
in our credit card business was partially offset by pullbacks in closed-end loans. Year over year purchase volume decreased by $2.8
billion or 2.7% to $103.0 billion. The main reason for the decrease was a result of light volumes in the fourth quarter of 2008 as the
consumer began to feel the effects of the recession. International Card loans decreased by $2.9 billion or 25.2% to $8.7 billion.
Without movement in exchange rates, the portfolio would have stayed flat.
Total revenue from 2007 to 2008 increased $33.0 million or 0.3% to $12.1 billion. Net interest income increased $133.1 million or
1.8% to $7.5 billion. Non-interest income was down by $80.1 million or 1.7% to $4.7 billion. In Domestic Card, total revenue was up
by $211.6 million to $10.6 billion from 2007 to 2008. Net interest income increased $220.2 million or 3.5% to $6.5 billion. This
increase followed the 2.8% increase in average loans. Non-interest income was basically flat, down by only $8.5 million or 0.2% to
$4.1 billion. The stable portfolio size resulted in little changes in non-interest income from year to year. International Card total
revenue in 2008 was $1.5 billion, $158.6 million or 9.4% lower than 2007. Over half of the decline was due to exchange rate
movements. The remainder of the decline is primarily from lower non-interest income from fewer accounts on file.