Capital One 2009 Annual Report Download - page 55
Download and view the complete annual report
Please find page 55 of the 2009 Capital One annual report below. You can navigate through the pages in the report by either clicking on the pages listed below, or by using the keyword search tool below to find specific information within the annual report.-
 1
1 -
2
-
3
-
4
-
5
-
6
-
7
-
8
-
9
-
10
-
11
-
12
-
13
-
14
-
15
-
16
-
17
-
18
-
19
-
20
-
21
-
22
-
23
-
24
-
25
-
26
-
27
-
28
-
29
-
30
-
31
-
32
-
33
-
34
-
35
-
36
-
37
-
38
-
39
-
40
-
41
-
42
-
43
-
44
-
 45
45 -
 46
46 -
 47
47 -
 48
48 -
 49
49 -
 50
50 -
 51
51 -
 52
52 -
 53
53 -
 54
54 -
 55
55 -
 56
56 -
 57
57 -
 58
58 -
 59
59 -
 60
60 -
 61
61 -
 62
62 -
 63
63 -
 64
64 -
 65
65 -
66
-
67
-
68
-
69
-
70
-
71
-
72
-
73
-
74
-
75
-
76
-
77
-
78
-
79
-
80
-
81
-
82
-
83
-
84
-
85
-
86
-
87
-
88
-
89
-
90
-
91
-
92
-
93
-
94
-
95
-
96
-
97
-
98
-
99
-
100
-
101
-
102
-
103
-
104
-
105
-
106
-
107
-
108
-
109
-
110
-
111
-
112
-
113
-
114
-
115
-
116
-
117
-
118
-
119
-
120
-
121
-
122
-
123
-
124
-
125
-
126
-
127
-
128
-
129
-
130
-
131
-
132
-
133
-
134
-
135
-
136
-
137
-
138
-
139
-
140
-
141
-
142
-
143
-
144
-
145
-
146
-
147
-
148
-
149
-
150
-
151
-
152
-
153
-
154
-
155
-
156
-
157
-
158
-
159
-
160
-
161
-
162
-
163
-
164
-
165
-
166
-
167
-
168
-
169
-
170
-
171
-
172
-
173
-
174
-
175
-
176
-
177
-
178
-
179
-
180
-
181
-
182
-
183
-
184
-
185
-
186
-
187
-
188
-
189
-
190
-
191
-
192
-
193
-
194
-
195
-
196
-
197
-
198
-
199
-
200
-
201
-
202
-
203
-
204
-
205
-
206
-
207
-
208
-
209
 |
 |

42
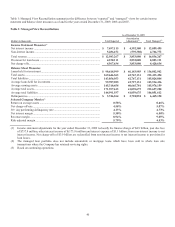
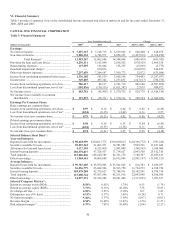
As of December 31, 2007
(Dollars in thousands)
Total Reported Securitization
Adjustments(1)
Total Managed(2)
Income Statement Measures(3)
N
et interest income .................................................................................
.
$ 6,529,845 $ 4,489,905 $ 11,019,750
N
on-interest income ................................................................................
.
8,054,223 (2,288,455) 5,765,768
Total revenue ..........................................................................................
.
$ 14,584,068 $ 2,201,450 $ 16,785,518
Provision for loan losses .........................................................................
.
2,636,502 2,201,450 4,837,952
N
et charge-offs .......................................................................................
.
1,960,545 2,201,450 4,161,995
Balance Sheet Measures
Loans held for investment .......................................................................
.
$ 101,805,027 $ 49,557,390 $ 151,362,417
Total assets ..............................................................................................
.
150,590,369 48,706,677 199,297,046
Total liabilities ........................................................................................
.
126,296,257 48,706,677 175,002,934
Average loans held for investment ..........................................................
.
93,836,760 51,185,182 145,021,942
Average earning assets ............................................................................
.
124,426,473 49,075,710 173,502,183
Average total assets ................................................................................
.
148,983,192 50,410,103 199,393,295
Average total liabilities ...........................................................................
.
123,780,056 50,411,179 174,191,235
Delinquencies ..........................................................................................
.
$ 3,721,444 $ 2,142,353 $ 5,863,797
Selected Company Metrics(3)
Return on average assets .........................................................................
.
1.79% 1.33%
N
et charge-off rate ..................................................................................
.
2.10% 2.88%
30+ day performing delinquency rate .....................................................
.
3.66% 3.87%
N
et interest margin ..................................................................................
.
5.38% 6.46%
Revenue margin ......................................................................................
.
12.01% 9.85%
Risk adjusted margin...............................................................................
.
10.40% 7.40%
(1) Income statement adjustments for the year ended December 31, 2007 reclassify the finance charge of $6.3 billion, past due fees
of $1.0 billion, other interest income of $(167.3) million and interest expense of $2.7 billion; from non –interest income to net
interest income. Net charge-offs of $2.2 billion are reclassified from non-interest income to net interest income to provision for
loan losses.
(2) The managed loan portfolio does not include automobile or mortgage loans which have been sold in whole loan sale
transactions where the Company has retained servicing rights.
(3) Based on continuing operations.