Capital One 2009 Annual Report Download - page 115
Download and view the complete annual report
Please find page 115 of the 2009 Capital One annual report below. You can navigate through the pages in the report by either clicking on the pages listed below, or by using the keyword search tool below to find specific information within the annual report.-
 1
1 -
2
-
3
-
4
-
5
-
6
-
7
-
8
-
9
-
10
-
11
-
12
-
13
-
14
-
15
-
16
-
17
-
18
-
19
-
20
-
21
-
22
-
23
-
24
-
25
-
26
-
27
-
28
-
29
-
30
-
31
-
32
-
33
-
34
-
35
-
36
-
37
-
38
-
39
-
40
-
41
-
42
-
43
-
44
-
45
-
46
-
47
-
48
-
49
-
50
-
51
-
52
-
53
-
54
-
55
-
56
-
57
-
58
-
59
-
60
-
61
-
62
-
63
-
64
-
65
-
66
-
67
-
68
-
69
-
70
-
71
-
72
-
73
-
74
-
75
-
76
-
77
-
78
-
79
-
80
-
81
-
82
-
83
-
84
-
85
-
86
-
87
-
88
-
89
-
90
-
91
-
92
-
93
-
94
-
95
-
96
-
97
-
98
-
99
-
100
-
101
-
102
-
103
-
104
-
 105
105 -
 106
106 -
 107
107 -
 108
108 -
 109
109 -
 110
110 -
 111
111 -
 112
112 -
 113
113 -
 114
114 -
 115
115 -
 116
116 -
 117
117 -
 118
118 -
 119
119 -
 120
120 -
 121
121 -
 122
122 -
 123
123 -
 124
124 -
 125
125 -
126
-
127
-
128
-
129
-
130
-
131
-
132
-
133
-
134
-
135
-
136
-
137
-
138
-
139
-
140
-
141
-
142
-
143
-
144
-
145
-
146
-
147
-
148
-
149
-
150
-
151
-
152
-
153
-
154
-
155
-
156
-
157
-
158
-
159
-
160
-
161
-
162
-
163
-
164
-
165
-
166
-
167
-
168
-
169
-
170
-
171
-
172
-
173
-
174
-
175
-
176
-
177
-
178
-
179
-
180
-
181
-
182
-
183
-
184
-
185
-
186
-
187
-
188
-
189
-
190
-
191
-
192
-
193
-
194
-
195
-
196
-
197
-
198
-
199
-
200
-
201
-
202
-
203
-
204
-
205
-
206
-
207
-
208
-
209
 |
 |

102
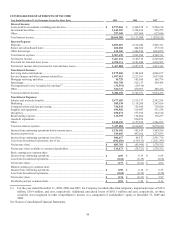
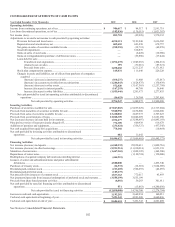
CONSOLIDATED STATEMENTS OF CASH FLOWS
Year Ended December 31 (In Thousands)
2009 2008
2007
Operating Activities:
Income from continuing operations, net of tax ................................................................... $ 986,617 $ 84,517 $ 2,591,719
Loss from discontinued operations, net of tax .................................................................... (102,836) (130,515) (1,021,387)
N
et income (loss) ................................................................................................................ 883,781 (45,998) 1,570,332
Adjustments to reconcile net income to cash provided by operating activities:
Provision for loan and lease losses ........................................................................... 4,230,111 5,101,040 2,636,502
Depreciation and amortization, net .......................................................................... 682,603 691,430 678,757
Net gains on sales of securities available for sale .................................................... (218,355) (12,791) (69,976)
Goodwill impairment ............................................................................................... — 810,876 —
Gains on sales of auto loans ..................................................................................... — (2,428) (10,960)
Gains on extinguishment/repurchase of debt/senior notes ....................................... — (53,860) (17,444)
Loans held for sale: ..................................................................................................
Transfers in and originations ......................................................................... (1,194,239) (1,949,263) (404,831)
(Gains) losses on sales ................................................................................... 399 (31,016) (87,521)
Proceeds from sales ....................................................................................... 1,228,468 2,211,225 6,171,912
Stock plan compensation expense ............................................................................ 145,831 111,646 229,228
Changes in assets and liabilities, net of effects from purchase of companies
acquired: .............................................................................................................
(Increase) decrease in interest receivable ...................................................... (108,237) 11,408 (35,017)
(Increase) in accounts receivable from securitizations .................................. (1,286,843) (1,624,875) (130,439)
(Increase) decrease in other assets ................................................................. 572,820 (3,107,565) (2,257,798)
Increase (decrease) in interest payable .......................................................... (167,293) 44,789 56,846
Increase (decrease) in other liabilities ........................................................... (1,955,446) 1,201,973 1,277,833
Net cash provided by (used in) operating activities attributable to discontinued
operations ........................................................................................................... (16,653) 126,384 3,293,456
Net cash provided by operating activities ........................................... 2,796,947 3,482,975 12,900,880
Investing Activities:
Purchases of securities available for sale ............................................................................ (27,827,065) (21,697,629) (12,717,204)
Proceeds from maturities of securities available for sale .................................................... 9,540,958 6,676,800 6,026,680
Proceeds from sales of securities available for sale ............................................................ 13,410,010 2,627,973 2,307,825
Proceeds from securitizations of loans ............................................................................... 12,068,309 10,046,699 12,641,050
N
et (increase) decrease in loans held for investment .......................................................... 1,932,677 (13,588,497) (18,895,193)
Principal recoveries of loans previously charged off .......................................................... 774,389 669,938 619,678
Additions of premises and equipment ................................................................................. (231,624) (356,327) (437,545)
N
et cash acquired from (paid for) acquisitions ................................................................... 778,166 — (10,464)
N
et cash provided by investing activities attributable to discontinued
operations ...................................................................................................................... 602 11,642 —
Net cash provided by (used in) investing activities ............................. 10,446,422 (15,609,401) (10,465,173)
Financing Activities:
N
et increase (decrease) in deposits ..................................................................................... (6,368,332) 25,859,613 (3,009,716)
N
et increase (decrease) in other borrowings ....................................................................... (5,911,914) (11,930,014) 6,853,338
Maturities of senior notes ................................................................................................... (1,447,365) (1,802,395) (462,500)
Repurchases of senior notes ................................................................................................ — (1,120,724) (150,000)
Redemptions of acquired company debt and noncontrolling interest ................................. (464,915) — —
Issuance of senior and subordinated notes and junior subordinated
debentures ..................................................................................................................... 4,500,000 — 1,495,740
Purchases of treasury stock ................................................................................................. (14,572) (12,501) (3,024,969)
Dividends paid-common stock ........................................................................................... (213,669) (568,255) (42,055)
Dividends paid-preferred stock ........................................................................................... (105,175) — —
N
et proceeds from issuances of common stoc
k
.................................................................. 1,537,363 772,017 43,493
N
et (payments)/proceeds from issuance/(redemption) of preferred stock and warrants ..... (3,555,199) 3,555,199 —
Proceeds from share based payment activities .................................................................... (6,881) 59,283 301,911
N
et cash provided by (used in) financing activities attributable to discontinued
operations ...................................................................................................................... 571 (15,863) (4,280,036)
Net cash provided by (used in) financing activities ............................ (12,050,088) 14,796,360 (2,274,794)
Increase in cash and cash equivalents ................................................................................. 1,193,281 2,669,934 160,913
Cash and cash equivalents at beginning of year .................................................................. 7,491,343 4,821,409 4,660,496
Cash and cash equivalents at end of year ............................................................................ $ 8,684,624 $ 7,491,343 $ 4,821,409
See Notes to Consolidated Financial Statements.