Capital One 2009 Annual Report Download - page 138
Download and view the complete annual report
Please find page 138 of the 2009 Capital One annual report below. You can navigate through the pages in the report by either clicking on the pages listed below, or by using the keyword search tool below to find specific information within the annual report.-
 1
1 -
2
-
3
-
4
-
5
-
6
-
7
-
8
-
9
-
10
-
11
-
12
-
13
-
14
-
15
-
16
-
17
-
18
-
19
-
20
-
21
-
22
-
23
-
24
-
25
-
26
-
27
-
28
-
29
-
30
-
31
-
32
-
33
-
34
-
35
-
36
-
37
-
38
-
39
-
40
-
41
-
42
-
43
-
44
-
45
-
46
-
47
-
48
-
49
-
50
-
51
-
52
-
53
-
54
-
55
-
56
-
57
-
58
-
59
-
60
-
61
-
62
-
63
-
64
-
65
-
66
-
67
-
68
-
69
-
70
-
71
-
72
-
73
-
74
-
75
-
76
-
77
-
78
-
79
-
80
-
81
-
82
-
83
-
84
-
85
-
86
-
87
-
88
-
89
-
90
-
91
-
92
-
93
-
94
-
95
-
96
-
97
-
98
-
99
-
100
-
101
-
102
-
103
-
104
-
105
-
106
-
107
-
108
-
109
-
110
-
111
-
112
-
113
-
114
-
115
-
116
-
117
-
118
-
119
-
120
-
121
-
122
-
123
-
124
-
125
-
126
-
127
-
 128
128 -
 129
129 -
 130
130 -
 131
131 -
 132
132 -
 133
133 -
 134
134 -
 135
135 -
 136
136 -
 137
137 -
 138
138 -
 139
139 -
 140
140 -
 141
141 -
 142
142 -
 143
143 -
 144
144 -
 145
145 -
 146
146 -
 147
147 -
 148
148 -
149
-
150
-
151
-
152
-
153
-
154
-
155
-
156
-
157
-
158
-
159
-
160
-
161
-
162
-
163
-
164
-
165
-
166
-
167
-
168
-
169
-
170
-
171
-
172
-
173
-
174
-
175
-
176
-
177
-
178
-
179
-
180
-
181
-
182
-
183
-
184
-
185
-
186
-
187
-
188
-
189
-
190
-
191
-
192
-
193
-
194
-
195
-
196
-
197
-
198
-
199
-
200
-
201
-
202
-
203
-
204
-
205
-
206
-
207
-
208
-
209
 |
 |

125
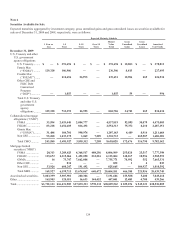
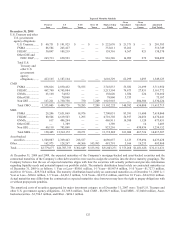
Expected Maturity Schedule
1 Year or
Less
1–5
Years
5–10
Years Over 10
Years Market Value
Totals
Gross
Unrealized
Gains
Gross
Unrealized
Losses
Amortized
Cost Totals
December 31, 2008
U.S. Treasury and other
U.S. government
agency obligations
U.S. Treasury ........ $ 40,751 $ 181,925 $ — $ — $ 222,676 $ 21,371 $ — $ 201,305
FNMA .................. 86,584 245,427 — — 332,011 15,262 — 316,749
FHLMC ................ 30,097 109,219 — — 139,316 9,567 821 130,570
Other GSE and
FDIC DGP ....... 265,733 650,593 — — 916,326 16,099 272 900,499
Total U.S.
Treasury and
other U.S.
government
agency
obligations ....... 423,165 1,187,164 — — 1,610,329 62,299 1,093 1,549,123
CMO
FNMA .................. 836,826 2,830,452 78,555 — 3,745,833 55,582 21,699 3,711,950
FHLMC ................ 467,790 4,745,804 — — 5,213,594 79,673 27,851 5,161,772
GNMA .................. 63,168 74,852 — — 138,020 1,584 224 136,660
Other GSE ............ — 78,860 — — 78,860 3,753 — 75,107
Non GSE .............. 167,221 1,750,758 730 7,209 1,925,918 — 604,306 2,530,224
Total CMO ........... 1,535,005 9,480,726 79,285 7,209 11,102,225 140,592 654,080 11,615,713
MBS
FNMA .................. 29,206 7,651,869 18,976 — 7,700,051 93,591 11,600 7,618,060
FHLMC ................ 80,504 4,619,503 1,295 — 4,701,302 54,917 24,056 4,670,441
GNMA .................. 617 486,294 — — 486,911 14,580 1,120 473,451
Other GSE ............ — 1,389 — — 1,389 — 14 1,403
Non GSE .............. 40,118 783,098 — — 823,216 — 430,936 1,254,152
Total MBS ............ 150,445 13,542,153 20,271 — 13,712,869 163,088 467,726 14,017,507
Asset-backed
securities ................... 1,508,087 2,369,443 218,527 — 4,096,057 2,123 339,494 4,433,428
Other .............................. 162,975 128,267 44,566 145,983 481,791 5,166 19,235 495,860
Total ............................... $3,779,677 $26,707,753 $ 362,649 $ 153,192 $31,003,271 $ 373,268 $1,481,628 $ 32,111,631
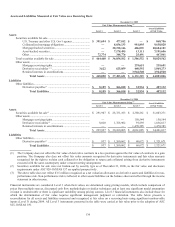
At December 31, 2009 and 2008, the expected maturities of the Company’s mortgage-backed and asset-backed securities and the
contractual maturities of the Company’s other debt securities were used to assign the securities into the above maturity groupings. The
Company believes that the use of expected maturities aligns with how the securities will actually perform and provides information
regarding liquidity needs and potential impacts on portfolio yields. The maturity distribution based solely on contractual maturities as
of December 31, 2009 is as follows: 1 Year or Less—$380.1 million, 1-5 Years—$6,967.4 million, 5-10 Years—$1,727.3 million,
and Over 10 Years—$29,754.8 million. The maturity distribution based solely on contractual maturities as of December 31, 2008 is: 1
Year or Less—$268.6 million, 1-5 Years—$4,263.5 million, 5-10 Years—$2,233.2 million, and Over 10 Years—$24,238.0 million.
Actual maturities may differ from the contractual or expected maturities since borrowers may have the right to prepay obligations with
or without prepayment penalties.
The amortized costs of securities aggregated by major investment category as of December 31, 2007 were: Total U.S. Treasury and
other U.S. government agency obligations - $1,369.8 million, Total CMO - $8,856.9 million, Total MBS - $7,040.0 million, Asset-
backed securities - $1,796.5 million, and Other - $696.1 million.