Capital One 2009 Annual Report Download - page 166
Download and view the complete annual report
Please find page 166 of the 2009 Capital One annual report below. You can navigate through the pages in the report by either clicking on the pages listed below, or by using the keyword search tool below to find specific information within the annual report.-
 1
1 -
2
-
3
-
4
-
5
-
6
-
7
-
8
-
9
-
10
-
11
-
12
-
13
-
14
-
15
-
16
-
17
-
18
-
19
-
20
-
21
-
22
-
23
-
24
-
25
-
26
-
27
-
28
-
29
-
30
-
31
-
32
-
33
-
34
-
35
-
36
-
37
-
38
-
39
-
40
-
41
-
42
-
43
-
44
-
45
-
46
-
47
-
48
-
49
-
50
-
51
-
52
-
53
-
54
-
55
-
56
-
57
-
58
-
59
-
60
-
61
-
62
-
63
-
64
-
65
-
66
-
67
-
68
-
69
-
70
-
71
-
72
-
73
-
74
-
75
-
76
-
77
-
78
-
79
-
80
-
81
-
82
-
83
-
84
-
85
-
86
-
87
-
88
-
89
-
90
-
91
-
92
-
93
-
94
-
95
-
96
-
97
-
98
-
99
-
100
-
101
-
102
-
103
-
104
-
105
-
106
-
107
-
108
-
109
-
110
-
111
-
112
-
113
-
114
-
115
-
116
-
117
-
118
-
119
-
120
-
121
-
122
-
123
-
124
-
125
-
126
-
127
-
128
-
129
-
130
-
131
-
132
-
133
-
134
-
135
-
136
-
137
-
138
-
139
-
140
-
141
-
142
-
143
-
144
-
145
-
146
-
147
-
148
-
149
-
150
-
151
-
152
-
153
-
154
-
155
-
 156
156 -
 157
157 -
 158
158 -
 159
159 -
 160
160 -
 161
161 -
 162
162 -
 163
163 -
 164
164 -
 165
165 -
 166
166 -
 167
167 -
 168
168 -
 169
169 -
 170
170 -
 171
171 -
 172
172 -
 173
173 -
 174
174 -
 175
175 -
 176
176 -
177
-
178
-
179
-
180
-
181
-
182
-
183
-
184
-
185
-
186
-
187
-
188
-
189
-
190
-
191
-
192
-
193
-
194
-
195
-
196
-
197
-
198
-
199
-
200
-
201
-
202
-
203
-
204
-
205
-
206
-
207
-
208
-
209
 |
 |

153
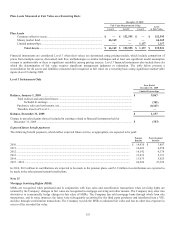
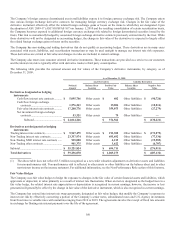
Plan Assets Measured at Fair Value on a Recurring Basis
December 31, 2009
Fair Value Measurements Using
Assets
at Fair Value
Level 1 Level 2
Level 3
Plan Assets
Common collective trusts ............................................................................. $ — $ 152,595 $ — $ 152,595
Money market fund ...................................................................................... 66,169 — — 66,169
Limited partnerships ..................................................................................... — — 1,157 1,157
Total Assets ........................................................................................ $ 66,169 $ 152,595 $ 1,157 $ 219,921
Financial instruments are considered Level 3 when their values are determined using pricing models, which include comparison of
prices from multiple sources, discounted cash flow methodologies or similar techniques and at least one significant model assumption
or input is unobservable or there is significant variability among pricing sources. Level 3 financial instruments also include those for
which the determination of fair value requires significant management judgment or estimation. The table below presents a
reconciliation for all assets and liabilities measured and recognized at fair value on a recurring basis using significant unobservable
inputs (Level 3) during 2009.
Level 3 Instruments Only
Year Ended
December 31, 2009
Limited Partnerships
Balance, January 1, 2009 .............................................................................................................................. $ 9,867
Total realized and unrealized losses: .....................................................................................................
Included in earnings ..................................................................................................................... (383)
Purchases, sales and settlements, net ..................................................................................................... (8,327)
Transfers in(out) of Level 3 ................................................................................................................... —
Balance, December 31, 2009 $ 1,157
Change in unrealized gains (losses) included in earnings related to financial instruments held at
December 31, 2009 .................................................................................................................................... $ (383)
Expected future benefit payments
The following benefit payments, which reflect expected future service, as appropriate, are expected to be paid:
Pension
Benefits
Postretirement
Benefits
2010 .............................................................................................................................................................
.
$ 14,436 $ 3,887
2011 .............................................................................................................................................................
.
14,422 4,258
2012 .............................................................................................................................................................
.
14,142 4,378
2013 .............................................................................................................................................................
.
13,432 5,191
2014 .............................................................................................................................................................
.
13,675 5,425
2015 - 2019 ..................................................................................................................................................
.
64,294 27,320
In 2010, $0.9 million in contributions are expected to be made to the pension plans, and $1.9 million in contributions are expected to
be made to the other postretirement benefit plans.
Note 15
Mortgage Servicing Rights (MSR)
MSRs are recognized when purchased and in conjunction with loan sales and securitization transactions when servicing rights are
retained by the Company; changes in fair value are recognized in mortgage servicing and other income. The Company may enter into
derivatives to economically hedge changes in fair value of MSRs. The Company has sold mortgage loans through whole loan sale
transactions, and in some instances the loans were subsequently securitized by the third party purchaser and transferred into a VIE,
and also through securitization transactions. The Company records the MSR at estimated fair value and has no other loss exposure in
excess of the recorded fair value.