Capital One 2009 Annual Report Download - page 149
Download and view the complete annual report
Please find page 149 of the 2009 Capital One annual report below. You can navigate through the pages in the report by either clicking on the pages listed below, or by using the keyword search tool below to find specific information within the annual report.-
 1
1 -
2
-
3
-
4
-
5
-
6
-
7
-
8
-
9
-
10
-
11
-
12
-
13
-
14
-
15
-
16
-
17
-
18
-
19
-
20
-
21
-
22
-
23
-
24
-
25
-
26
-
27
-
28
-
29
-
30
-
31
-
32
-
33
-
34
-
35
-
36
-
37
-
38
-
39
-
40
-
41
-
42
-
43
-
44
-
45
-
46
-
47
-
48
-
49
-
50
-
51
-
52
-
53
-
54
-
55
-
56
-
57
-
58
-
59
-
60
-
61
-
62
-
63
-
64
-
65
-
66
-
67
-
68
-
69
-
70
-
71
-
72
-
73
-
74
-
75
-
76
-
77
-
78
-
79
-
80
-
81
-
82
-
83
-
84
-
85
-
86
-
87
-
88
-
89
-
90
-
91
-
92
-
93
-
94
-
95
-
96
-
97
-
98
-
99
-
100
-
101
-
102
-
103
-
104
-
105
-
106
-
107
-
108
-
109
-
110
-
111
-
112
-
113
-
114
-
115
-
116
-
117
-
118
-
119
-
120
-
121
-
122
-
123
-
124
-
125
-
126
-
127
-
128
-
129
-
130
-
131
-
132
-
133
-
134
-
135
-
136
-
137
-
138
-
 139
139 -
 140
140 -
 141
141 -
 142
142 -
 143
143 -
 144
144 -
 145
145 -
 146
146 -
 147
147 -
 148
148 -
 149
149 -
 150
150 -
 151
151 -
 152
152 -
 153
153 -
 154
154 -
 155
155 -
 156
156 -
 157
157 -
 158
158 -
 159
159 -
160
-
161
-
162
-
163
-
164
-
165
-
166
-
167
-
168
-
169
-
170
-
171
-
172
-
173
-
174
-
175
-
176
-
177
-
178
-
179
-
180
-
181
-
182
-
183
-
184
-
185
-
186
-
187
-
188
-
189
-
190
-
191
-
192
-
193
-
194
-
195
-
196
-
197
-
198
-
199
-
200
-
201
-
202
-
203
-
204
-
205
-
206
-
207
-
208
-
209
 |
 |

136
(3) An end of quarter convention is used to reflect activity in retained interests in securitizations, resulting in all transactions and
assumption changes being reflected as if they occurred on the last day of the quarter. Gains (losses) related to Level 3 retained
interests in securitizations are reported in servicing and securitizations income, which is a component of non-interest income.
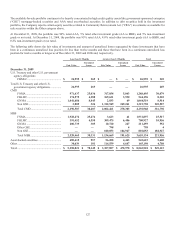
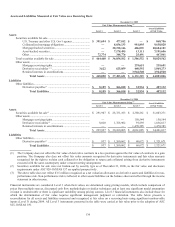
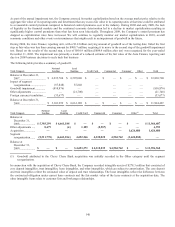
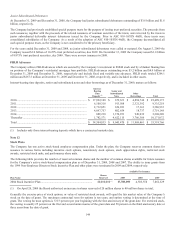
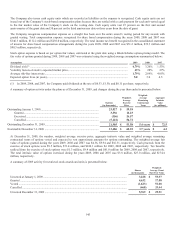
Assets and Liabilities Measured at Fair Value on a Nonrecurring Basis
The Company is also required to measure and recognize certain other financial assets at fair value on a nonrecurring basis in the
consolidated balance sheet. For assets measured at fair value on a nonrecurring basis and still held on the consolidated balance sheet at
December 31, 2009 and 2008, the following table provides the fair value measures by level of valuation assumptions used and the
amount of fair value adjustments recorded in earnings for those assets. Fair value adjustments for loans held for sale, foreclosed assets,
and other assets are recorded in other non-interest expense, and fair value adjustments for loans held for investment are recorded in
provision for loan and lease losses in the consolidated statement of income.
December 31, 2009
Fair Value Measurements Using Assets at
Fair Value Total
Losses
Level 1 Level 2 Level 3
Assets
Loans held for sale ..................................................................
.
$ — $ 266,240 $ — $ 266,240 $ 15,433
Loans held for investment .......................................................
.
— 39,367 231,375 270,742 114,869
Foreclosed assets(1) ..................................................................
.
— 197,386 — 197,386 26,211
Other ........................................................................................
.
— 31,310 — 31,310 (3,866)
Total .............................................................................
.
$ — $ 534,303 $ 231,375 $ 765,678 $ 152,647
December 31, 2008
Fair Value Measurements Using Assets at
Fair Value Total
Losses
Level 1 Level 2 Level 3
Assets
Loans held for sale ..................................................................... $ — $ 68,462 $ — $ 68, 462 $ 14,386
Loans held for investment .......................................................... — 64,737 142,768 207,505 62,747
Total ................................................................................ $ — $ 133,199 $ 142,768 $ 275,967 $ 77,133
(1) Represents the fair value and related losses of foreclosed properties that were written down subsequent to their initial
classification as foreclosed properties.
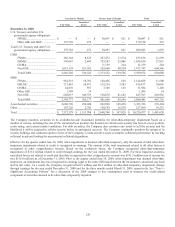
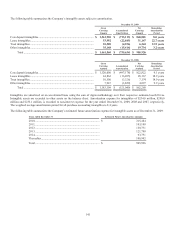
Fair Value of Financial Instruments
The following reflects the fair value of financial instruments whether or not recognized on the consolidated balance sheet at fair value.
December 31, 2009 December 31, 2008
Carrying
Amount Estimated
Fair Value Carrying
Amount
Estimated
Fair Value
Financial Assets
Cash and cash equivalents .......................................................... $ 8,684,624 $ 8,684,624 $ 7,491,343 $ 7,491,343
Securities available for sale ........................................................ 38,829,562 38,829,562 31,003,271 31,003,271
Securities held to maturity .......................................................... 80,577 80,577 — —
Loans held for sale ...................................................................... 268,307 268,307 68,462 68,462
N
et loans held for investmen
t
..................................................... 86,491,604 86,158,212 96,493,811 86,370,194
Interest receivable ....................................................................... 936,146 936,146 827,909 827,909
Accounts receivable from securitization ..................................... 7,629,597 7,629,597 6,342,754 6,342,754
Derivatives .................................................................................. 1,069,273 1,069,273 1,836,817 1,836,817
Mortgage servicing rights ........................................................... 239,651 239,651 150,544 150,544
Financial Liabilities
N
on-interest bearing deposits...................................................... $ 13,438,659 $ 13,438,659 $ 11,293,852 $ 11,293,852
Interest-bearing deposits ............................................................. 102,370,437 102,616,339 97,326,937 98,031,913
Senior and subordinated notes .................................................... 9,045,470 9,156,030 8,308,843 6,922,300
Other borrowings ........................................................................ 11,968,461 11,723,046 14,869,648 12,948,145
Interest payable ........................................................................... 509,105 509,105 676,398 676,398
Derivatives .................................................................................. 407,132 407,132 1,321,671 1,321,671