Capital One 2009 Annual Report Download - page 74
Download and view the complete annual report
Please find page 74 of the 2009 Capital One annual report below. You can navigate through the pages in the report by either clicking on the pages listed below, or by using the keyword search tool below to find specific information within the annual report.-
 1
1 -
2
-
3
-
4
-
5
-
6
-
7
-
8
-
9
-
10
-
11
-
12
-
13
-
14
-
15
-
16
-
17
-
18
-
19
-
20
-
21
-
22
-
23
-
24
-
25
-
26
-
27
-
28
-
29
-
30
-
31
-
32
-
33
-
34
-
35
-
36
-
37
-
38
-
39
-
40
-
41
-
42
-
43
-
44
-
45
-
46
-
47
-
48
-
49
-
50
-
51
-
52
-
53
-
54
-
55
-
56
-
57
-
58
-
59
-
60
-
61
-
62
-
63
-
 64
64 -
 65
65 -
 66
66 -
 67
67 -
 68
68 -
 69
69 -
 70
70 -
 71
71 -
 72
72 -
 73
73 -
 74
74 -
 75
75 -
 76
76 -
 77
77 -
 78
78 -
 79
79 -
 80
80 -
 81
81 -
 82
82 -
 83
83 -
 84
84 -
85
-
86
-
87
-
88
-
89
-
90
-
91
-
92
-
93
-
94
-
95
-
96
-
97
-
98
-
99
-
100
-
101
-
102
-
103
-
104
-
105
-
106
-
107
-
108
-
109
-
110
-
111
-
112
-
113
-
114
-
115
-
116
-
117
-
118
-
119
-
120
-
121
-
122
-
123
-
124
-
125
-
126
-
127
-
128
-
129
-
130
-
131
-
132
-
133
-
134
-
135
-
136
-
137
-
138
-
139
-
140
-
141
-
142
-
143
-
144
-
145
-
146
-
147
-
148
-
149
-
150
-
151
-
152
-
153
-
154
-
155
-
156
-
157
-
158
-
159
-
160
-
161
-
162
-
163
-
164
-
165
-
166
-
167
-
168
-
169
-
170
-
171
-
172
-
173
-
174
-
175
-
176
-
177
-
178
-
179
-
180
-
181
-
182
-
183
-
184
-
185
-
186
-
187
-
188
-
189
-
190
-
191
-
192
-
193
-
194
-
195
-
196
-
197
-
198
-
199
-
200
-
201
-
202
-
203
-
204
-
205
-
206
-
207
-
208
-
209
 |
 |

61
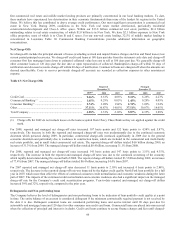
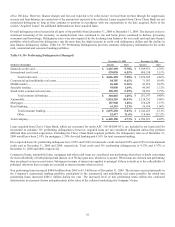
off at 180 days. However, finance charges and fees not expected to be collected are reversed from revenue through the suppression
account and loan balances are carried net of the amount not expected to be collected. Loans acquired from Chevy Chase Bank are not
considered delinquent so long as they continue to perform in accordance with our expectations at the date acquired. Refer to the
section “Acquired Loans” for additional information on these acquired loans.
Overall delinquency rates increased in all parts of the portfolio from December 31, 2008 to December 31, 2009. The increase is due to
continued worsening of the economy, as unemployment rates continued to rise and home prices continued to decline, pressuring
consumers and borrowings. Delinquency rates were also impacted by the declining loan balances for our credit card and auto finance
portfolios which affected the delinquency rate far more than the slight increase in credit card delinquency dollars and the decline in
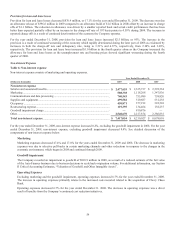
auto finance delinquency dollars. Table 14: 30+ Performing Delinquencies provides summary delinquency information for the credit
card, commercial and consumer banking portfolios.
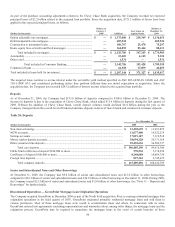
Table 14: 30+ Performing Delinquencies (Managed)
December 31, 2009 December 31, 2008
(Dollars in thousands)
Amount Rate
Amount Rate
Domestic credit card ........................................................................................... $ 3,487,390 5.78% $ 3,389,971 4.78%
International credit card ...................................................................................... 539,030 6.55% 480,534 5.51%
Total credit card ........................................................................................ $ 4,026,420 5.88% $ 3,870,505 4.86%
Commercial and multifamily real estate ............................................................. 84,385 0.61% 71,583 0.54%
Middle market .................................................................................................... 46,148 0.46% 43,854 0.43%
Specialty lending ................................................................................................ 59,958 1.69% 46,907 1.32%
Small ticket commercial real estate .................................................................... 120,392 5.59% 98,853 3.79%
Total commercial banking ........................................................................ $ 310,883 1.05% $ 261,197 0.88%
Automobile ......................................................................................................... 1,824,255 10.03% 2,128,352 9.90%
Mortgages ........................................................................................................... 187,940 1.26% 158,429 1.57%
Retail banking ..................................................................................................... 63,243 1.23% 59,674 1.06%
Total consumer banking ............................................................................ $ 2,075,438 5.43% $ 2,346,455 6.31%
Other ......................................................................................................... 52,417 11.6% 118,066 22.12%
Total company .................................................................................................... $ 6,465,158 4.73% $ 6,596,223 4.49%
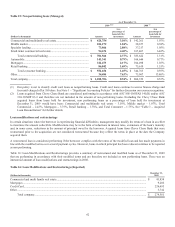
Loans acquired from Chevy Chase Bank, which are accounted for under ASC 310-10/SOP 03-3, are included in our loans held for
investment to calculate 30+ performing delinquencies; however, acquired loans are not considered delinquent unless they perform
different than our initial expectation. Excluding the Chevy Chase Bank acquired portfolio, the delinquency rates as of December 31,
2009 would have been 2.18% for mortgages, 1.30% for retail banking and 6.56% for total consumer banking.
On a reported basis 30+ performing delinquencies is 5.85% and 5.06% for domestic credit card and 5.85% and 4.52% for international
credit card at December 31, 2009 and 2008, respectively. Total credit card 30+ performing delinquencies is 4.13% and 4.37% at
December 31, 2009 and 2008, respectively.
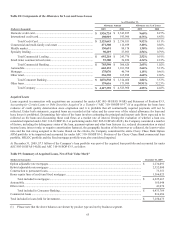
Commercial loans, automobile loans, mortgages and other retail loans are considered non performing when there is doubt concerning
the full collectibility of both principal and interest or at 90 days past due, whichever is sooner. When loans are deemed non performing
they are placed on non accrual status. Subsequent receipts of interest are applied to principal if there is doubt as to the collectibility of
principal; otherwise these receipts are recorded as interest income when received.
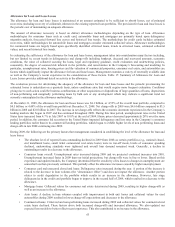
Non performing loans increased $484.4 million from 2008 to $1.3 billion as of December 31, 2009. The increase occurred primarily in
the Company’s commercial banking portfolio, particularly in the commercial and multifamily real estate portfolio for which non
performing loans increased $286.5 million during the year. The increased level of non performing loans reflects the continued
deterioration in economic factors and particularly in the value of the collateral underlying the Company’s loans.