Capital One 2009 Annual Report Download - page 95
Download and view the complete annual report
Please find page 95 of the 2009 Capital One annual report below. You can navigate through the pages in the report by either clicking on the pages listed below, or by using the keyword search tool below to find specific information within the annual report.-
 1
1 -
2
-
3
-
4
-
5
-
6
-
7
-
8
-
9
-
10
-
11
-
12
-
13
-
14
-
15
-
16
-
17
-
18
-
19
-
20
-
21
-
22
-
23
-
24
-
25
-
26
-
27
-
28
-
29
-
30
-
31
-
32
-
33
-
34
-
35
-
36
-
37
-
38
-
39
-
40
-
41
-
42
-
43
-
44
-
45
-
46
-
47
-
48
-
49
-
50
-
51
-
52
-
53
-
54
-
55
-
56
-
57
-
58
-
59
-
60
-
61
-
62
-
63
-
64
-
65
-
66
-
67
-
68
-
69
-
70
-
71
-
72
-
73
-
74
-
75
-
76
-
77
-
78
-
79
-
80
-
81
-
82
-
83
-
84
-
 85
85 -
 86
86 -
 87
87 -
 88
88 -
 89
89 -
 90
90 -
 91
91 -
 92
92 -
 93
93 -
 94
94 -
 95
95 -
 96
96 -
 97
97 -
 98
98 -
 99
99 -
 100
100 -
 101
101 -
 102
102 -
 103
103 -
 104
104 -
 105
105 -
106
-
107
-
108
-
109
-
110
-
111
-
112
-
113
-
114
-
115
-
116
-
117
-
118
-
119
-
120
-
121
-
122
-
123
-
124
-
125
-
126
-
127
-
128
-
129
-
130
-
131
-
132
-
133
-
134
-
135
-
136
-
137
-
138
-
139
-
140
-
141
-
142
-
143
-
144
-
145
-
146
-
147
-
148
-
149
-
150
-
151
-
152
-
153
-
154
-
155
-
156
-
157
-
158
-
159
-
160
-
161
-
162
-
163
-
164
-
165
-
166
-
167
-
168
-
169
-
170
-
171
-
172
-
173
-
174
-
175
-
176
-
177
-
178
-
179
-
180
-
181
-
182
-
183
-
184
-
185
-
186
-
187
-
188
-
189
-
190
-
191
-
192
-
193
-
194
-
195
-
196
-
197
-
198
-
199
-
200
-
201
-
202
-
203
-
204
-
205
-
206
-
207
-
208
-
209
 |
 |

82
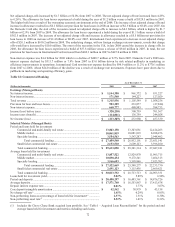
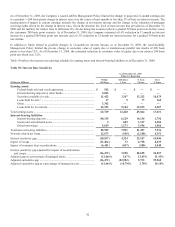
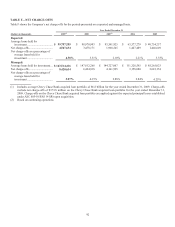
As of December 31, 2009, the Company’s Asset/Liability Management Policy limited the change in projected 12-month earnings due
to a gradual +/-200 basis points change in interest rates over the course of nine months to less than 5% of base net interest income. The
measurement of impact to current earnings includes the change in net interest income and the change in the valuation of mortgage
servicing rights driven by the change in interest rates. Given the absolute low level of interest rates that prevailed as of December 31,
2009 and the inability for market rates to fall below 0%, the declining rate scenario reflects a gradual 50 basis point rate decline versus
the customary 200 basis point scenario. As of December 31, 2009, the Company estimated a 0.4% reduction in 12-month net interest
income for a gradual 200 basis point rate increase and a 0.1% reduction in 12-month net interest income for a gradual 50 basis point
rate decline.
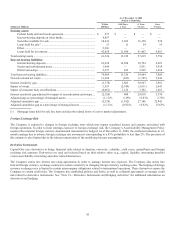
In addition to limits related to possible changes in 12-month net interest income, as of December 31, 2009, the Asset/Liability
Management Policy limited the pre-tax change in economic value of equity due to instantaneous parallel rate shocks of 200 basis
points to less than 12%. As of December 31, 2009, the estimated reduction in economic value of equity due to an adverse 200 basis
point rate shock was 3.2%.
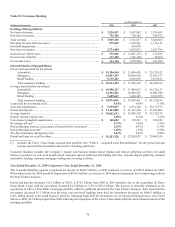
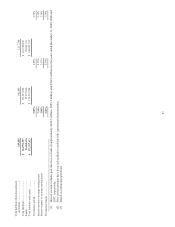
Table 30 reflects the interest rate repricing schedule for earning assets and interest-bearing liabilities as of December 31, 2009.
Table 30: Interest Rate Sensitivity
As of December 31, 2009
Subject to Repricing
(Dollars in Millions)
Within
180 Days >180 Days-
1 Year
>1 Year-
5 Years Over
5 Years
Earning assets:
Federal funds sold and resale agreement ........................................... $ 542 $ — $ — $ —
Interest-bearing deposits at other banks ............................................ 5,043 — — —
Securities available for sale ............................................................... 11,432 3,307 13,212 10,879
Loans held for sale(1) ......................................................................... 17 9 77 165
Other ................................................................................................. 3,302 — — —
Loans held for investment ................................................................. 42,393 9,104 32,535 6,587
Total earning assets .................................................................................... 62,729 12,420 45,824 17,631
Interest-bearing liabilities:
Interest-bearing deposits ................................................................... 80,315 6,129 14,134 1,792
Senior and subordinated notes........................................................... 5 689 3,767 4,584
Other borrowings .............................................................................. 5,639 1,173 3,596 1,560
Total interest-bearing liabilities .................................................................. 85,959 7,991 21,497 7,936
N
on-rate related net items ........................................................................... 12,673 (105 ) (2,180) 4,351
Interest sensitivity gap ................................................................................ (10,557 ) 4,324 22,147 14,046
Impact of swaps .......................................................................................... (11,464 ) 73 6,758 4,633
Impact of consumer loan securitizations ..................................................... (4,451 ) (847 ) (250) 5,548
Interest sensitivity gap adjusted for impact of securitizations
and swaps ............................................................................................... (26,472 ) 3,550 28,655 24,227
Adjusted gap as a percentage of managed assets ........................................ (12.46)% 1.67% 13.49% 11.41%
Adjusted cumulative gap ............................................................................ (26,472 ) (22,922 ) 5,733 29,960
Adjusted cumulative gap as a percentage of managed assets ..................... (12.46)% (10.79)% 2.70% 14.10%