Capital One 2009 Annual Report Download - page 70
Download and view the complete annual report
Please find page 70 of the 2009 Capital One annual report below. You can navigate through the pages in the report by either clicking on the pages listed below, or by using the keyword search tool below to find specific information within the annual report.-
 1
1 -
2
-
3
-
4
-
5
-
6
-
7
-
8
-
9
-
10
-
11
-
12
-
13
-
14
-
15
-
16
-
17
-
18
-
19
-
20
-
21
-
22
-
23
-
24
-
25
-
26
-
27
-
28
-
29
-
30
-
31
-
32
-
33
-
34
-
35
-
36
-
37
-
38
-
39
-
40
-
41
-
42
-
43
-
44
-
45
-
46
-
47
-
48
-
49
-
50
-
51
-
52
-
53
-
54
-
55
-
56
-
57
-
58
-
59
-
 60
60 -
 61
61 -
 62
62 -
 63
63 -
 64
64 -
 65
65 -
 66
66 -
 67
67 -
 68
68 -
 69
69 -
 70
70 -
 71
71 -
 72
72 -
 73
73 -
 74
74 -
 75
75 -
 76
76 -
 77
77 -
 78
78 -
 79
79 -
 80
80 -
81
-
82
-
83
-
84
-
85
-
86
-
87
-
88
-
89
-
90
-
91
-
92
-
93
-
94
-
95
-
96
-
97
-
98
-
99
-
100
-
101
-
102
-
103
-
104
-
105
-
106
-
107
-
108
-
109
-
110
-
111
-
112
-
113
-
114
-
115
-
116
-
117
-
118
-
119
-
120
-
121
-
122
-
123
-
124
-
125
-
126
-
127
-
128
-
129
-
130
-
131
-
132
-
133
-
134
-
135
-
136
-
137
-
138
-
139
-
140
-
141
-
142
-
143
-
144
-
145
-
146
-
147
-
148
-
149
-
150
-
151
-
152
-
153
-
154
-
155
-
156
-
157
-
158
-
159
-
160
-
161
-
162
-
163
-
164
-
165
-
166
-
167
-
168
-
169
-
170
-
171
-
172
-
173
-
174
-
175
-
176
-
177
-
178
-
179
-
180
-
181
-
182
-
183
-
184
-
185
-
186
-
187
-
188
-
189
-
190
-
191
-
192
-
193
-
194
-
195
-
196
-
197
-
198
-
199
-
200
-
201
-
202
-
203
-
204
-
205
-
206
-
207
-
208
-
209
 |
 |

57
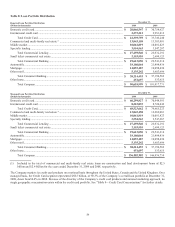
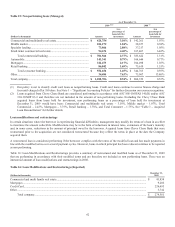
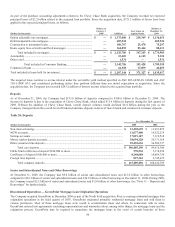
Table 9: Credit Card Concentrations (Managed)
December 31, 2009 December 31, 2008
(Dollars in thousands)
Loans Percent
Loans Percent
D
omestic Card
California ....................................................................................................
.
$ 7,192,401 11.93% $ 8,478,567 11.95%
Texas ..........................................................................................................
.
4,096,685 6.79% 5,657,916 7.98%
N
ew Yor
k
...................................................................................................
.
3,916,966 6.50% 5,171,520 7.29%
Florida ........................................................................................................
.
3,759,220 6.24% 4,746,580 6.69%
Illinois .........................................................................................................
.
2,653,102 4.40% 3,034,636 4.28%
Pennsylvania ...............................................................................................
.
2,640,735 4.38% 2,819,761 3.97%
Ohio ............................................................................................................
.
2,383,837 3.95% 2,674,512 3.77%
Virginia .......................................................................................................
.
1,749,504 2.90% 1,915,860 2.70%
Other ...........................................................................................................
.
31,907,377 52.91% 36,445,229 51.37%
Total Domestic Card .........................................................................
.
$ 60,299,827 88.00% $ 70,944,581 89.05%
I
nternational Card
United Kingdom .........................................................................................
.
$ 4,716,981 57.36% $ 5,527,237 63.38%
Canada ........................................................................................................
.
3,506,854 42.64% 3,193,405 36.62%
Total International Card ....................................................................
.
$ 8,223,835 12.00% $ 8,720,642 10.95%
Total Credit Card ..............................................................................
.
$ 68,523,662 50.25% $ 79,665,223 54.41%
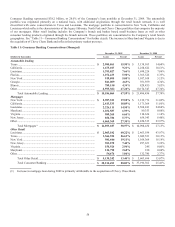
Commercial Banking represented $29.6 billion, or 21.7% of the Company’s managed loan portfolio at December 31, 2009. The
Company operates its Commercial Banking business primarily in the geographies in which it maintains retail bank branches. As a
result, most of the portfolio is located in New York, Louisiana and Texas, the Company’s largest retail banking markets. The small
ticket commercial real estate portfolio was originated on a national basis through a broker network, and is in run-off mode. See “Table
10—Commercial Banking Concentrations” for further details.
Table 10: Commercial Banking Concentrations (Managed)
December 31, 2009 December 31, 2008
(Dollars in thousands)
Loans Percent
Loans Percent
Commercial Lending
N
ew Yor
k
..................................................................................................... $ 12,565,715 45.76% $ 13,348,236 49.56%
Louisiana ...................................................................................................... 3,592,447 13.08% 3,582,074 13.30%
Texas ............................................................................................................ 2,784,960 10.14% 2,446,243 9.08%
N
ew Jerse
y
................................................................................................... 2,252,663 8.20% 2,369,315 8.80%
Massachusetts .............................................................................................. 618,664 2.25% 426,733 1.59%
California ..................................................................................................... 570,742 2.08% 527,101 1.96%
Maryland ...................................................................................................... 509,199 1.86% 99,622 0.37%
Virginia ........................................................................................................ 454,150 1.66% 89,410 0.33%
Other ............................................................................................................ 4,111,000 14.97% 4,043,457 15.01%
Total Commercial Lending ................................................................. $ 27,459,540 92.73% $ 26,932,191 91.17%
S
mall Ticket Commercial Real Estat
e
N
ew Yor
k
..................................................................................................... $ 863,790 40.11% $ 1,006,996 38.60%
California ..................................................................................................... 468,183 21.74% 519,018 19.89%
Massachusetts .............................................................................................. 165,703 7.70% 214,925 8.24%
N
ew Jerse
y
................................................................................................... 122,952 5.71% 158,448 6.07%
Florida .......................................................................................................... 93,901 4.36% 134,607 5.16%
Other ............................................................................................................ 438,981 20.38% 575,129 22.04%
Total Small Ticket Commercial Real Estate ...................................... $ 2,153,510 7.27% $ 2,609,123 8.83%
Total Commercial Banking ................................................................ $ 29,613,050 21.72% $ 29,541,314 20.18%