Capital One 2009 Annual Report Download - page 147
Download and view the complete annual report
Please find page 147 of the 2009 Capital One annual report below. You can navigate through the pages in the report by either clicking on the pages listed below, or by using the keyword search tool below to find specific information within the annual report.-
 1
1 -
2
-
3
-
4
-
5
-
6
-
7
-
8
-
9
-
10
-
11
-
12
-
13
-
14
-
15
-
16
-
17
-
18
-
19
-
20
-
21
-
22
-
23
-
24
-
25
-
26
-
27
-
28
-
29
-
30
-
31
-
32
-
33
-
34
-
35
-
36
-
37
-
38
-
39
-
40
-
41
-
42
-
43
-
44
-
45
-
46
-
47
-
48
-
49
-
50
-
51
-
52
-
53
-
54
-
55
-
56
-
57
-
58
-
59
-
60
-
61
-
62
-
63
-
64
-
65
-
66
-
67
-
68
-
69
-
70
-
71
-
72
-
73
-
74
-
75
-
76
-
77
-
78
-
79
-
80
-
81
-
82
-
83
-
84
-
85
-
86
-
87
-
88
-
89
-
90
-
91
-
92
-
93
-
94
-
95
-
96
-
97
-
98
-
99
-
100
-
101
-
102
-
103
-
104
-
105
-
106
-
107
-
108
-
109
-
110
-
111
-
112
-
113
-
114
-
115
-
116
-
117
-
118
-
119
-
120
-
121
-
122
-
123
-
124
-
125
-
126
-
127
-
128
-
129
-
130
-
131
-
132
-
133
-
134
-
135
-
136
-
 137
137 -
 138
138 -
 139
139 -
 140
140 -
 141
141 -
 142
142 -
 143
143 -
 144
144 -
 145
145 -
 146
146 -
 147
147 -
 148
148 -
 149
149 -
 150
150 -
 151
151 -
 152
152 -
 153
153 -
 154
154 -
 155
155 -
 156
156 -
 157
157 -
158
-
159
-
160
-
161
-
162
-
163
-
164
-
165
-
166
-
167
-
168
-
169
-
170
-
171
-
172
-
173
-
174
-
175
-
176
-
177
-
178
-
179
-
180
-
181
-
182
-
183
-
184
-
185
-
186
-
187
-
188
-
189
-
190
-
191
-
192
-
193
-
194
-
195
-
196
-
197
-
198
-
199
-
200
-
201
-
202
-
203
-
204
-
205
-
206
-
207
-
208
-
209
 |
 |

134
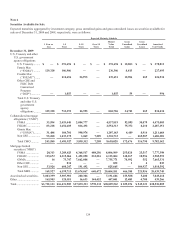
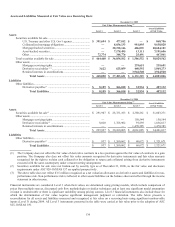
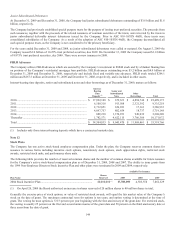
Assets and Liabilities Measured at Fair Value on a Recurring Basis
December 31, 2009
Fair Value Measurements Using (3)
Level 1 Level 2 Level 3
Assets/Liabilities
at Fair Value
Assets
Securities available for sale ...........................................................
U.S. Treasury and other U.S. Gov’t agency ......................... $ 391,694 $ 477,012 $ — $ 868,706
Collateralized mortgage obligations .................................... — 8,656,133 981,895 9,638,028
Mortgage-backed securities ................................................. — 20,198,146 486,035 20,684,181
Asset-backed securities ........................................................ — 7,178,495 13,111 7,191,606
Other .................................................................................... 72,774 348,776 25,491 447,041
Total securities available for sale .................................................. $ 464,468 $ 36,858,562 $ 1,506,532 $ 38,829,562
Other assets ...................................................................................
Mortgage servicing rights .................................................... — — 239,651 239,651
Derivative receivables(1) (3) ..................................................... 3,622 625,059 440,592 1,069,273
Retained interests in securitizations ..................................... — — 3,944,540 3,944,540
Total Assets ............................................................... $ 468,090 $ 37,483,621 $ 6,131,315 $ 44,083,026
Liabilities
Other liabilities ..............................................................................
Derivative payables(1) .......................................................... $ 8,189 $ 366,010 $ 32,934 $ 407,132
Total Liabilities ......................................................... $ 8,189 $ 366,010 $ 32,934 $ 407,132
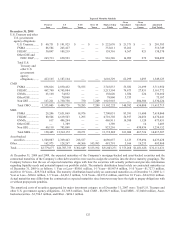
December 31, 2008
Fair Value Measurements Using (3) Assets/Liabilities
at Fair Value
Level 1 Level 2 Level 3
Assets
Securities available for sale(2) ........................................................ $ 291,907 $ 28,331,103 $ 2,380,261 $ 31,003,271
Other assets ...................................................................................
Mortgage servicing rights .................................................... — — 150,544 150,544
Derivative receivables(1) ...................................................... 8,020 1,768,902 59,895 1,836,817
Retained interests in securitizations ..................................... — — 1,470,385 1,470,385
Total Assets ............................................................... $ 299,927 $ 30,100,005 $ 4,061,085 $ 34,461,017
Liabilities
Other liabilities ..............................................................................
Derivative payables(1) .......................................................... $ 937 $ 1,260,062 $ 60,672 $ 1,321,671
Total Liabilities ......................................................... $ 937 $ 1,260,062 $ 60,672 $ 1,321,671
(1) The Company does not offset the fair value of derivative contracts in a loss position against the fair value of contracts in a gain
position. The Company also does not offset fair value amounts recognized for derivative instruments and fair value amounts
recognized for the right to reclaim cash collateral or the obligation to return cash collateral arising from derivative instruments
executed with the same counterparty under a master netting arrangement.
(2) Securities available for sale were not broken-out by security type as of December 31, 2008, as the fair value and disclosure
requirements under ASC 820-10/SFAS 157 are applied prospectively.
(3) The above table does not reflect $3.5 million recognized as a net valuation allowance on derivative assets and liabilities for non-
performance risk. Non-performance risk is reflected in other assets/liabilities on the balance sheet and offset through the income
statement in other income.
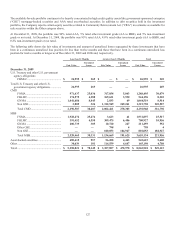
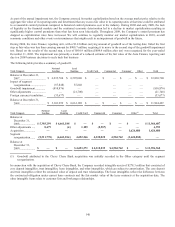
Financial instruments are considered Level 3 when their values are determined using pricing models, which include comparison of
prices from multiple sources, discounted cash flow methodologies or similar techniques and at least one significant model assumption
or input is unobservable or there is significant variability among pricing sources. Level 3 financial instruments also include those for
which the determination of fair value requires significant management judgment or estimation. The table below presents a
reconciliation for all assets and liabilities measured and recognized at fair value on a recurring basis using significant unobservable
inputs (Level 3) during 2009. All Level 3 instruments presented in the table were carried at fair value prior to the adoption of ASC
825-10/SFAS 159.