Capital One 2009 Annual Report Download - page 53
Download and view the complete annual report
Please find page 53 of the 2009 Capital One annual report below. You can navigate through the pages in the report by either clicking on the pages listed below, or by using the keyword search tool below to find specific information within the annual report.-
 1
1 -
2
-
3
-
4
-
5
-
6
-
7
-
8
-
9
-
10
-
11
-
12
-
13
-
14
-
15
-
16
-
17
-
18
-
19
-
20
-
21
-
22
-
23
-
24
-
25
-
26
-
27
-
28
-
29
-
30
-
31
-
32
-
33
-
34
-
35
-
36
-
37
-
38
-
39
-
40
-
41
-
42
-
 43
43 -
 44
44 -
 45
45 -
 46
46 -
 47
47 -
 48
48 -
 49
49 -
 50
50 -
 51
51 -
 52
52 -
 53
53 -
 54
54 -
 55
55 -
 56
56 -
 57
57 -
 58
58 -
 59
59 -
 60
60 -
 61
61 -
 62
62 -
 63
63 -
64
-
65
-
66
-
67
-
68
-
69
-
70
-
71
-
72
-
73
-
74
-
75
-
76
-
77
-
78
-
79
-
80
-
81
-
82
-
83
-
84
-
85
-
86
-
87
-
88
-
89
-
90
-
91
-
92
-
93
-
94
-
95
-
96
-
97
-
98
-
99
-
100
-
101
-
102
-
103
-
104
-
105
-
106
-
107
-
108
-
109
-
110
-
111
-
112
-
113
-
114
-
115
-
116
-
117
-
118
-
119
-
120
-
121
-
122
-
123
-
124
-
125
-
126
-
127
-
128
-
129
-
130
-
131
-
132
-
133
-
134
-
135
-
136
-
137
-
138
-
139
-
140
-
141
-
142
-
143
-
144
-
145
-
146
-
147
-
148
-
149
-
150
-
151
-
152
-
153
-
154
-
155
-
156
-
157
-
158
-
159
-
160
-
161
-
162
-
163
-
164
-
165
-
166
-
167
-
168
-
169
-
170
-
171
-
172
-
173
-
174
-
175
-
176
-
177
-
178
-
179
-
180
-
181
-
182
-
183
-
184
-
185
-
186
-
187
-
188
-
189
-
190
-
191
-
192
-
193
-
194
-
195
-
196
-
197
-
198
-
199
-
200
-
201
-
202
-
203
-
204
-
205
-
206
-
207
-
208
-
209
 |
 |

40
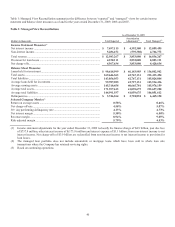
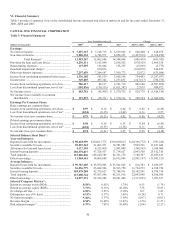
Table 1: Managed View Reconciliation summarizes the difference between “reported” and “managed” views for certain income
statement and balance sheet measures as of and for the years ended December 31, 2009, 2008 and 2007.
Table 1: Managed View Reconciliations
As of December 31, 2009
(Dollars in thousands)
Total Reported Securitization
Adjustments(1)
Total Managed(2)
Income Statement Measures(3)
N
et interest income ............................................................................................ $ 7,697,115 $ 4,392,380 $ 12,089,495
N
on-interest income ........................................................................................... 5,286,152 (539,380) 4,746,772
Total revenue ..................................................................................................... $ 12,983,267 $ 3,853,000 $ 16,836,267
Provision for loan losses .................................................................................... 4,230,111 3,853,000 8,083,111
N
et charge-offs ................................................................................................... 4,567,634 3,853,000 8,420,634
Balance Sheet Measures
Loans held for investment .................................................................................. $ 90,618,999 $ 46,183,903 $ 136,802,902
Total assets ......................................................................................................... 169,646,363 42,767,131 212,413,494
Total liabilities ................................................................................................... 143,056,953 42,767,131 185,824,084
Average loans held for investment ..................................................................... 99,787,285 43,727,131 143,514,416
Average earning assets ....................................................................................... 145,310,458 40,665,701 185,976,159
Average total assets ............................................................................................ 171,597,613 41,059,675 212,657,288
Average total liabilities ...................................................................................... 144,991,937 41,059,675 186,051,612
Delinquencies ..................................................................................................... $ 3,746,264 $ 2,718,894 $ 6,465,158
Selected Com
p
an
y
Metrics(3)
Return on average assets .................................................................................... 0.58% 0.46%
N
et charge-off rate ............................................................................................. 4.58% 5.87%
30+ day performing delinquency rate ................................................................ 4.13% 4.73%
N
et interest margin ............................................................................................. 5.30% 6.50%
Revenue margin ................................................................................................. 8.94% 9.05%
Risk adjusted margin .......................................................................................... 5.79% 4.53%
(1) Income statement adjustments for the year ended December 31, 2009 reclassify the finance charge of $4.9 billion, past due fees
of $757.9 million, other interest income of $(173.9) million and interest expense of $1.1 billion; from non-interest income to net
interest income. Net charge-offs of $3.9 billion are reclassified from non-interest income to net interest income to provision for
loan losses.
(2) The managed loan portfolio does not include automobile or mortgage loans which have been sold in whole loan sale
transactions where the Company has retained servicing rights.
(3) Based on continuing operations.