Capital One 2009 Annual Report Download - page 135
Download and view the complete annual report
Please find page 135 of the 2009 Capital One annual report below. You can navigate through the pages in the report by either clicking on the pages listed below, or by using the keyword search tool below to find specific information within the annual report.-
 1
1 -
2
-
3
-
4
-
5
-
6
-
7
-
8
-
9
-
10
-
11
-
12
-
13
-
14
-
15
-
16
-
17
-
18
-
19
-
20
-
21
-
22
-
23
-
24
-
25
-
26
-
27
-
28
-
29
-
30
-
31
-
32
-
33
-
34
-
35
-
36
-
37
-
38
-
39
-
40
-
41
-
42
-
43
-
44
-
45
-
46
-
47
-
48
-
49
-
50
-
51
-
52
-
53
-
54
-
55
-
56
-
57
-
58
-
59
-
60
-
61
-
62
-
63
-
64
-
65
-
66
-
67
-
68
-
69
-
70
-
71
-
72
-
73
-
74
-
75
-
76
-
77
-
78
-
79
-
80
-
81
-
82
-
83
-
84
-
85
-
86
-
87
-
88
-
89
-
90
-
91
-
92
-
93
-
94
-
95
-
96
-
97
-
98
-
99
-
100
-
101
-
102
-
103
-
104
-
105
-
106
-
107
-
108
-
109
-
110
-
111
-
112
-
113
-
114
-
115
-
116
-
117
-
118
-
119
-
120
-
121
-
122
-
123
-
124
-
 125
125 -
 126
126 -
 127
127 -
 128
128 -
 129
129 -
 130
130 -
 131
131 -
 132
132 -
 133
133 -
 134
134 -
 135
135 -
 136
136 -
 137
137 -
 138
138 -
 139
139 -
 140
140 -
 141
141 -
 142
142 -
 143
143 -
 144
144 -
 145
145 -
146
-
147
-
148
-
149
-
150
-
151
-
152
-
153
-
154
-
155
-
156
-
157
-
158
-
159
-
160
-
161
-
162
-
163
-
164
-
165
-
166
-
167
-
168
-
169
-
170
-
171
-
172
-
173
-
174
-
175
-
176
-
177
-
178
-
179
-
180
-
181
-
182
-
183
-
184
-
185
-
186
-
187
-
188
-
189
-
190
-
191
-
192
-
193
-
194
-
195
-
196
-
197
-
198
-
199
-
200
-
201
-
202
-
203
-
204
-
205
-
206
-
207
-
208
-
209
 |
 |

122
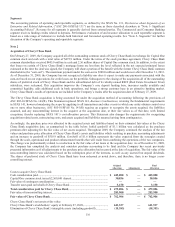
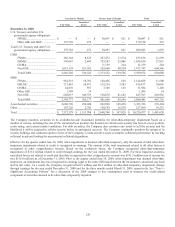
Year Ended December 31, 2007
Total Company
Credit
Card
Commercial
Banking
Consumer
Banking Other Total
Managed (1) Securitization
Adjustment(1)
Total
Reported
N
et interest income ....... $ 7,330,367 $ 931,227 $ 2,915,693 $ (157,537) $ 11,019,750 $ (4,489,905) $ 6,529,845
N
on-interest income ...... 4,758,466 127,029 924,872 (44,599) 5,765,768 2,288,455 8,054,223
Provision for loan and
lease losses ............... 3,635,567 (27,844) 1,116,143 114,086 4,837,952 (2,201,450) 2,636,502
Restructuring
expenses ................... — — — 138,237 138,237 — 138,237
Other non-interest
expenses ................... 4,801,636 384,733 2,567,794 185,610 7,939,773 — 7,939,773
Income tax provision
(benefit) .................... 1,254,899 244,028 54,699 (275,789) 1,277,837 — 1,277,837
N
et income (loss) from
continuing
operations net
of tax ........................ $ 2,396,731 $ 457,339 $ 101,929 $ (364,280) $ 2,591,719 $ — $ 2,591,719
Loans held for
investment ................ $ 81,380,091 $ 27,047,241 $ 42,349,296 $ 585,789 $151,362,417 $(49,557,390) $101,805,027
Total deposits ................ $ — $ 14,876,726 $ 57,692,006 $ 10,192,444 $ 82,761,176 $ — $ 82,761,176
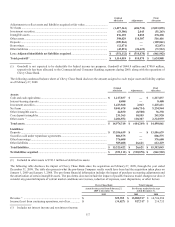
(1) Income statement adjustments for the year ended December 31, 2009 reclassify the finance charge of $4.9 billion, past due fees
of $0.8 billion, other interest income of $(0.2) billion and interest expense of $1.1 billion; from non –interest income to net
interest income. Net charge-offs of $3.9 billion are reclassified from non-interest income to provision for loan losses.
Income statement adjustments for the year ended December 31, 2008 reclassify the finance charge of $5.6 billion, past due fees
of $0.9 billion, other interest income of $(0.2) billion and interest expense of $2.1 billion; from non – interest income to net
interest income. Net charge-offs of $2.9 billion are reclassified from non-interest income to provision for loan losses.
Income statement adjustments for the year ended December 31, 2007 reclassify the finance charge of $6.3 billion, past due fees
of $1.0 billion, other interest income of $(0.2) billion and interest expense of $2.7 billion; from non –interest income to net
interest income. Net charge-offs of $2.2 billion are reclassified from non-interest income to provision for loan losses.
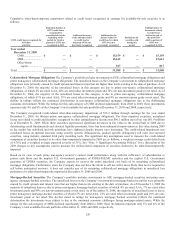
Significant Segment Adjustments That Affect Comparability
In 2009, the Company recorded an additional $80.5 million related to the Federal Deposit Insurance Corporation (“FDIC”) special
assessment. The amount was allocated to non-interest expense based on each segment’s share of FDIC insured deposits.
During 2009, the Company began a hedge program on brokered CDs, by entering into interest rate swap agreements, designated as
fair value hedges, converting a portion of the Company’s brokered CD liabilities from fixed rates to variable rates. As a result, the
Company recognized a reduction of $75.0 million in interest expense.
During 2009, the Company sold approximately $8.4B of FNMA, FHLMC, MBS, ABS and CMBS securities with generally shorter
expected maturities and purchased $8.3B billion of GNMA securities with generally longer expected maturities for overall asset
liability management purposes. In addition, GNMA securities also provide regulatory capital savings over FNMA and FHLMC
securities based on their risk weight of zero percent. As a result of these sales, gains of $218.4 million were recognized in non interest
income.
During 2008, the Company recognized a goodwill impairment charge of $810.9 million in the Consumer Banking segment.
During 2008, the Company repurchased approximately $1.0 billion of certain senior unsecured debt, recognizing a gain of $52.0
million in non-interest income and reported in the Other category. The Company initiated the repurchases to take advantage of the
current market environment and replaced the repurchased debt with lower-rate unsecured funding.
During 2007, the Company completed the sale of its interest in a relationship agreement to develop and market consumer credit
products in Spain and recorded a net gain related to this sale of $31.3 million consisting of a $41.6 million increase in non-interest
income partially offset by a $10.3 million increase in non-interest expense. This gain was recorded in the Credit Card segment.