Capital One 2009 Annual Report Download - page 90
Download and view the complete annual report
Please find page 90 of the 2009 Capital One annual report below. You can navigate through the pages in the report by either clicking on the pages listed below, or by using the keyword search tool below to find specific information within the annual report.-
 1
1 -
2
-
3
-
4
-
5
-
6
-
7
-
8
-
9
-
10
-
11
-
12
-
13
-
14
-
15
-
16
-
17
-
18
-
19
-
20
-
21
-
22
-
23
-
24
-
25
-
26
-
27
-
28
-
29
-
30
-
31
-
32
-
33
-
34
-
35
-
36
-
37
-
38
-
39
-
40
-
41
-
42
-
43
-
44
-
45
-
46
-
47
-
48
-
49
-
50
-
51
-
52
-
53
-
54
-
55
-
56
-
57
-
58
-
59
-
60
-
61
-
62
-
63
-
64
-
65
-
66
-
67
-
68
-
69
-
70
-
71
-
72
-
73
-
74
-
75
-
76
-
77
-
78
-
79
-
 80
80 -
 81
81 -
 82
82 -
 83
83 -
 84
84 -
 85
85 -
 86
86 -
 87
87 -
 88
88 -
 89
89 -
 90
90 -
 91
91 -
 92
92 -
 93
93 -
 94
94 -
 95
95 -
 96
96 -
 97
97 -
 98
98 -
 99
99 -
 100
100 -
101
-
102
-
103
-
104
-
105
-
106
-
107
-
108
-
109
-
110
-
111
-
112
-
113
-
114
-
115
-
116
-
117
-
118
-
119
-
120
-
121
-
122
-
123
-
124
-
125
-
126
-
127
-
128
-
129
-
130
-
131
-
132
-
133
-
134
-
135
-
136
-
137
-
138
-
139
-
140
-
141
-
142
-
143
-
144
-
145
-
146
-
147
-
148
-
149
-
150
-
151
-
152
-
153
-
154
-
155
-
156
-
157
-
158
-
159
-
160
-
161
-
162
-
163
-
164
-
165
-
166
-
167
-
168
-
169
-
170
-
171
-
172
-
173
-
174
-
175
-
176
-
177
-
178
-
179
-
180
-
181
-
182
-
183
-
184
-
185
-
186
-
187
-
188
-
189
-
190
-
191
-
192
-
193
-
194
-
195
-
196
-
197
-
198
-
199
-
200
-
201
-
202
-
203
-
204
-
205
-
206
-
207
-
208
-
209
 |
 |

77
use of brokered deposits to “well-capitalized” insured depository institutions and, with a waiver from the Federal Deposit Insurance
Corporation, to “adequately capitalized” institutions. At December 31, 2009, the Banks and the Corporation were “well-capitalized” as
defined under the federal banking regulatory guidelines. Based on the Company’s historical access to the brokered deposit market, it
expects to replace maturing brokered deposits with new brokered deposits or with the Company’s direct deposits and branch deposits.
Brokered deposits are included in other consumer time deposits and money market deposit accounts.
Table 24: Maturities of Time Deposits of $100,000 or More provides a summary of the future maturities of large denomination time
deposits. The Company’s funding and liquidity planning factors in the maturities of these deposits. Based on past activity, the
Company expects to retain a portion of these deposits as they mature. Therefore, the expected net cash outflow will be less than
reported in the summary table.
Table 24: Maturities of Large Denomination Certificates—$100,000 or More
As of December 31,
2009 2008
(Dollars in thousands) Balance Percent
Balance Percent
Three months or less ...................................................................................... $ 1,463,865 16.6% $ 1,683,153 15.0%
Over 3 through 6 months ............................................................................... 1,272,982 14.4% 1,820,956 16.1%
Over 6 through 12 months ............................................................................. 1,623,255 18.4% 3,319,048 29.5%
Over 12 months through 10 years .................................................................. 4,466,442 50.6% 4,435,887 39.4%
Total ............................................................................................................... $ 8,826,544 100.0% $ 11,259,044 100.0%
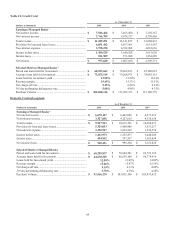
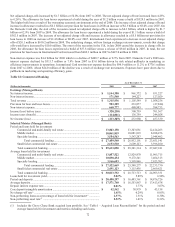
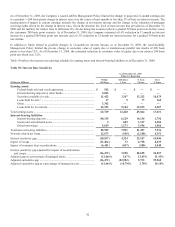
Table 25: Deposit Composition and Average Deposit Rates provides a summary of the composition of period end, average deposits,
interest expense and the average deposit rate paid for the periods presented.
Table 25: Deposit Composition and Average Deposit Rates
Year Ended December 31, 2009
Period End
Balance Average
Balance Interest
Expense
% of
Average
Deposits
Average
Deposit
Rate
N
on-interest bearing....................................................... $ 13,438,659 $ 12,522,536 N/A 10.83% N/A
N
OW accounts ............................................................... 12,077,480 10,690,040 60,483 9.25% 0.57%
Money market deposit accounts ..................................... 38,094,228 35,055,131 411,932 30.32% 1.18%
Savings accounts ............................................................ 17,019,187 11,340,122 78,708 9.81% 0.69%
Other consumer time deposits ........................................ 25,455,636 32,735,884 1,112,651 28.32% 3.40%
Total core deposits................................................ 106,085,190 102,343,713 1,663,774 88.53% 1.63%
Public fund certificates of deposit of $100,000
or more ...................................................................... 578,536 1,034,249 13,585 0.89% 1.31%
Certificates of deposit of $100,000 or more ................... 8,248,008 10,366,490 384,815 8.97% 3.71%
Foreign time deposits ..................................................... 897,362 1,856,292 30,845 1.61% 1.66%
Total deposits ....................................................... $ 115,809,096 $ 115,600,744 $ 2,093,019 100.00% 1.81%
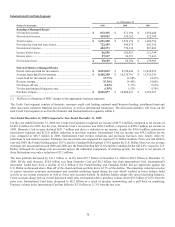
Year Ended December 31, 2008
Period End
Balance Average
Balance Interest
Expense
% of
Average
Deposits
Average
Deposit
Rate
N
on-interest bearing....................................................... $ 11,293,852 $ 10,772,019 N/A 11.52% N/A
N
OW accounts ............................................................... 10,522,219 9,305,767 120,143 9.95% 1.29%
Money market deposit accounts ..................................... 29,171,168 26,216,946 718,034 28.04% 2.74%
Savings accounts ............................................................ 7,119,510 7,821,040 71,546 8.36% 0.91%
Other consumer time deposits ........................................ 36,509,357 25,414,506 1,048,614 27.18% 4.13%
Total core deposits................................................ 94,616,106 79,530,278 1,958,337 85.05% 2.46%
Public fund certificates of deposit of $100,000
or more ...................................................................... 1,174,294 1,415,864 41,586 1.52% 2.94%
Certificates of deposit of $100,000 or more ................... 10,084,750 9,119,665 391,105 9.75% 4.29%
Foreign time deposits ..................................................... 2,745,639 3,441,839 121,010 3.68% 3.52%
Total deposits ....................................................... $ 108,620,789 $ 93,507,646 $ 2,512,038 100.00% 2.69%