Capital One 2009 Annual Report Download - page 192
Download and view the complete annual report
Please find page 192 of the 2009 Capital One annual report below. You can navigate through the pages in the report by either clicking on the pages listed below, or by using the keyword search tool below to find specific information within the annual report.-
 1
1 -
2
-
3
-
4
-
5
-
6
-
7
-
8
-
9
-
10
-
11
-
12
-
13
-
14
-
15
-
16
-
17
-
18
-
19
-
20
-
21
-
22
-
23
-
24
-
25
-
26
-
27
-
28
-
29
-
30
-
31
-
32
-
33
-
34
-
35
-
36
-
37
-
38
-
39
-
40
-
41
-
42
-
43
-
44
-
45
-
46
-
47
-
48
-
49
-
50
-
51
-
52
-
53
-
54
-
55
-
56
-
57
-
58
-
59
-
60
-
61
-
62
-
63
-
64
-
65
-
66
-
67
-
68
-
69
-
70
-
71
-
72
-
73
-
74
-
75
-
76
-
77
-
78
-
79
-
80
-
81
-
82
-
83
-
84
-
85
-
86
-
87
-
88
-
89
-
90
-
91
-
92
-
93
-
94
-
95
-
96
-
97
-
98
-
99
-
100
-
101
-
102
-
103
-
104
-
105
-
106
-
107
-
108
-
109
-
110
-
111
-
112
-
113
-
114
-
115
-
116
-
117
-
118
-
119
-
120
-
121
-
122
-
123
-
124
-
125
-
126
-
127
-
128
-
129
-
130
-
131
-
132
-
133
-
134
-
135
-
136
-
137
-
138
-
139
-
140
-
141
-
142
-
143
-
144
-
145
-
146
-
147
-
148
-
149
-
150
-
151
-
152
-
153
-
154
-
155
-
156
-
157
-
158
-
159
-
160
-
161
-
162
-
163
-
164
-
165
-
166
-
167
-
168
-
169
-
170
-
171
-
172
-
173
-
174
-
175
-
176
-
177
-
178
-
179
-
180
-
181
-
 182
182 -
 183
183 -
 184
184 -
 185
185 -
 186
186 -
 187
187 -
 188
188 -
 189
189 -
 190
190 -
 191
191 -
 192
192 -
 193
193 -
 194
194 -
 195
195 -
 196
196 -
 197
197 -
 198
198 -
 199
199 -
 200
200 -
 201
201 -
 202
202 -
203
-
204
-
205
-
206
-
207
-
208
-
209
 |
 |

179
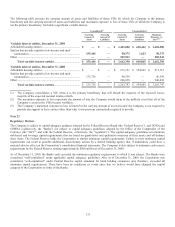
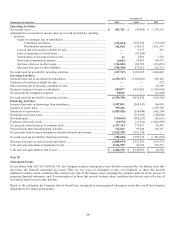
Note 27
Capital One Financial Corporation (Parent Company Only)
Condensed Financial Information
The following Parent Company Only financial statements are provided in accordance with Regulation S-X of the Securities and
Exchange Commission which requires all issuers or guarantors of registered securities to include separate annual financial statements.
December 31
Balance Sheets
2009
2008
Assets:
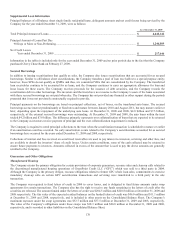
Cash and cash equivalents ...................................................................................................................
.
$ 6,466,156 $ 8,546,995
Investment in subsidiaries ....................................................................................................................
.
29,553,466 25,323,057
Loans to subsidiaries ............................................................................................................................
.
500,095 1,189,173
Securities available for sale .................................................................................................................
.
6,980 6,840
Other ....................................................................................................................................................
.
751,825 983,920
Total assets .................................................................................................................................
.
$ 37,278,522 $ 36,049,985
Liabilities:
Senior and subordinated notes .............................................................................................................
.
$ 6,048,394 $ 6,385,417
Other borrowings .................................................................................................................................
.
3,640,039 1,652,948
Other ....................................................................................................................................................
.
1,000,679 1,399,187
Total liabilities ............................................................................................................................
.
10,689,112 9,437,552
Stockholders’ Equity:
Preferred stock .....................................................................................................................................
.
— 3,096,466
Common stock .....................................................................................................................................
.
5,024 4,384
Paid-in-capital, net ...............................................................................................................................
.
18,954,823 17,278,102
Retained earnings .................................................................................................................................
.
10,727,368 10,621,164
Accumulated other comprehensive income (loss) ...............................................................................
.
82,654 (1,221,796)
Less: Treasury stock, at cost .......................................................................................................
.
(3,180,459) (3,165,887)
Stockholders’ equity ...................................................................................................................
.
26,589,410 26,612,433
Total liabilities and stockholders’ equity ....................................................................................
.
$ 37,278,522 $ 36,049,985
Year Ended December 31
Statements of Income
2009 2008
2007
Interest from temporary investments ............................................................................. $ 36,796 $ 184,234 $ 300,394
Interest expense .............................................................................................................. 335,917 424,541 504,708
Dividends, principally from bank subsidiaries ............................................................... 500,000 1,546,810 2,056,639
N
on-interest income ....................................................................................................... 32,377 110,911 12,982
N
on-interest expense ...................................................................................................... 90,008 137,265 241,660
Income before income taxes and equity in undistributed earnings of subsidiaries ........ 143,248 1,280,149 1,623,647
Income tax (benefit) expense ......................................................................................... (108,335) (93,552) (245,052)
Equity in undistributed earnings (loss) of subsidiaries .................................................. 735,034 (1,289,184) 723,020
Income from continuing operations, net of tax .............................................................. 986,617 84,517 2,591,719
Loss from discontinued operations, net of tax ............................................................... (102,836) (130,515) (1,021,387)
N
et income (loss) ........................................................................................................... $ 883,781 $ (45,998) $ 1,570,332