Capital One 2009 Annual Report Download - page 82
Download and view the complete annual report
Please find page 82 of the 2009 Capital One annual report below. You can navigate through the pages in the report by either clicking on the pages listed below, or by using the keyword search tool below to find specific information within the annual report.-
 1
1 -
2
-
3
-
4
-
5
-
6
-
7
-
8
-
9
-
10
-
11
-
12
-
13
-
14
-
15
-
16
-
17
-
18
-
19
-
20
-
21
-
22
-
23
-
24
-
25
-
26
-
27
-
28
-
29
-
30
-
31
-
32
-
33
-
34
-
35
-
36
-
37
-
38
-
39
-
40
-
41
-
42
-
43
-
44
-
45
-
46
-
47
-
48
-
49
-
50
-
51
-
52
-
53
-
54
-
55
-
56
-
57
-
58
-
59
-
60
-
61
-
62
-
63
-
64
-
65
-
66
-
67
-
68
-
69
-
70
-
71
-
 72
72 -
 73
73 -
 74
74 -
 75
75 -
 76
76 -
 77
77 -
 78
78 -
 79
79 -
 80
80 -
 81
81 -
 82
82 -
 83
83 -
 84
84 -
 85
85 -
 86
86 -
 87
87 -
 88
88 -
 89
89 -
 90
90 -
 91
91 -
 92
92 -
93
-
94
-
95
-
96
-
97
-
98
-
99
-
100
-
101
-
102
-
103
-
104
-
105
-
106
-
107
-
108
-
109
-
110
-
111
-
112
-
113
-
114
-
115
-
116
-
117
-
118
-
119
-
120
-
121
-
122
-
123
-
124
-
125
-
126
-
127
-
128
-
129
-
130
-
131
-
132
-
133
-
134
-
135
-
136
-
137
-
138
-
139
-
140
-
141
-
142
-
143
-
144
-
145
-
146
-
147
-
148
-
149
-
150
-
151
-
152
-
153
-
154
-
155
-
156
-
157
-
158
-
159
-
160
-
161
-
162
-
163
-
164
-
165
-
166
-
167
-
168
-
169
-
170
-
171
-
172
-
173
-
174
-
175
-
176
-
177
-
178
-
179
-
180
-
181
-
182
-
183
-
184
-
185
-
186
-
187
-
188
-
189
-
190
-
191
-
192
-
193
-
194
-
195
-
196
-
197
-
198
-
199
-
200
-
201
-
202
-
203
-
204
-
205
-
206
-
207
-
208
-
209
 |
 |

69
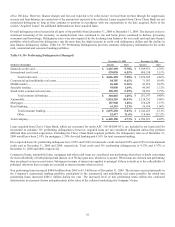
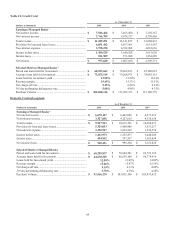
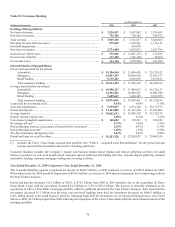
Table 21: Credit Card
As of December 31
(Dollars in thousands)
2009 2008
2007
Earnings (Managed Basis) (1)
N
et interest income .................................................................
.
$ 7,542,462 $ 7,463,480 $ 7,330,367
N
on-interest income ...............................................................
.
3,746,789 4,678,377 4,758,466
Total revenue ..........................................................................
.
$ 11,289,251 $ 12,141,857 $ 12,088,833
Provision for loan and lease losses .........................................
.
6,051,492 6,107,961 3,635,567
N
on-interest expense ..............................................................
.
3,738,230 4,392,968 4,801,636
Income before taxes................................................................
.
1,499,529 1,640,928 3,651,630
Income taxes ...........................................................................
.
521,909 573,908 1,254,899
N
et income .............................................................................
.
$ 977,620 $ 1,067,020 $ 2,396,731
Selected Metrics (Managed Basis) (1)
Period end loans held for investment .....................................
.
$ 68,523,662 $ 79,665,223 $ 81,380,091
Average loans held for investment .........................................
.
$ 73,075,519 $ 79,208,971 $ 78,085,153
Loans held for investment yield .............................................
.
12.90% 13.20% 14.14%
Revenue margin ......................................................................
.
15.45% 15.33% 15.51%
N
et charge-off rate .................................................................
.
9.15% 6.26% 4.23%
30+day performing delinquency rate ......................................
.
5.88% 4.86% 4.35%
Purchase Volume ....................................................................
.
$ 102,068,116 $ 113,835,373 $ 115,180,779
Domestic Card sub-segment
As of December 31,
(Dollars in thousands)
2009 2008
2007
Earnings (Managed Basis) (1)
N
et interest income .................................................................
.
$ 6,670,127 $ 6,492,086 $ 6,271,919
N
on-interest income ...............................................................
.
3,327,836 4,127,615 4,136,158
Total revenue ..........................................................................
.
$ 9,997,963 $ 10,619,701 $ 10,408,077
Provision for loan and lease losses .........................................
.
5,329,033 5,460,986 3,033,217
N
on-interest expense ..............................................................
.
3,255,957 3,622,838 3,934,574
Income before taxes ...............................................................
.
1,412,973 1,535,877 3,440,286
Income taxes ...........................................................................
.
494,542 537,557 1,183,458
N
et income (loss) ...................................................................
.
$ 918,431 $ 998,320 $ 2,256,828
Selected Metrics (Managed Basis)
Period end loans held for investment .....................................
.
$ 60,299,827 $ 70,944,581 $ 69,723,169
Average loans held for investment .........................................
.
$ 64,670,269 $ 68,638,180 $ 66,774,914
Loans held for investment yield .............................................
.
12.80% 13.09% 14.09%
Revenue margin ......................................................................
.
15.46% 15.47% 15.59%
N
et charge-off rate .................................................................
.
9.19% 6.33% 4.00%
30+day performing delinquency rate ......................................
.
5.78% 4.78% 4.28%
Purchase Volume ....................................................................
.
$ 93,566,239 $ 103,035,146 $ 105,875,472