Capital One 2009 Annual Report Download - page 86
Download and view the complete annual report
Please find page 86 of the 2009 Capital One annual report below. You can navigate through the pages in the report by either clicking on the pages listed below, or by using the keyword search tool below to find specific information within the annual report.-
 1
1 -
2
-
3
-
4
-
5
-
6
-
7
-
8
-
9
-
10
-
11
-
12
-
13
-
14
-
15
-
16
-
17
-
18
-
19
-
20
-
21
-
22
-
23
-
24
-
25
-
26
-
27
-
28
-
29
-
30
-
31
-
32
-
33
-
34
-
35
-
36
-
37
-
38
-
39
-
40
-
41
-
42
-
43
-
44
-
45
-
46
-
47
-
48
-
49
-
50
-
51
-
52
-
53
-
54
-
55
-
56
-
57
-
58
-
59
-
60
-
61
-
62
-
63
-
64
-
65
-
66
-
67
-
68
-
69
-
70
-
71
-
72
-
73
-
74
-
75
-
 76
76 -
 77
77 -
 78
78 -
 79
79 -
 80
80 -
 81
81 -
 82
82 -
 83
83 -
 84
84 -
 85
85 -
 86
86 -
 87
87 -
 88
88 -
 89
89 -
 90
90 -
 91
91 -
 92
92 -
 93
93 -
 94
94 -
 95
95 -
 96
96 -
97
-
98
-
99
-
100
-
101
-
102
-
103
-
104
-
105
-
106
-
107
-
108
-
109
-
110
-
111
-
112
-
113
-
114
-
115
-
116
-
117
-
118
-
119
-
120
-
121
-
122
-
123
-
124
-
125
-
126
-
127
-
128
-
129
-
130
-
131
-
132
-
133
-
134
-
135
-
136
-
137
-
138
-
139
-
140
-
141
-
142
-
143
-
144
-
145
-
146
-
147
-
148
-
149
-
150
-
151
-
152
-
153
-
154
-
155
-
156
-
157
-
158
-
159
-
160
-
161
-
162
-
163
-
164
-
165
-
166
-
167
-
168
-
169
-
170
-
171
-
172
-
173
-
174
-
175
-
176
-
177
-
178
-
179
-
180
-
181
-
182
-
183
-
184
-
185
-
186
-
187
-
188
-
189
-
190
-
191
-
192
-
193
-
194
-
195
-
196
-
197
-
198
-
199
-
200
-
201
-
202
-
203
-
204
-
205
-
206
-
207
-
208
-
209
 |
 |
73
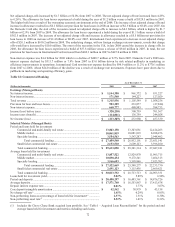
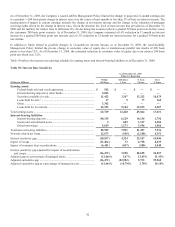
Year Ended December 31, 2009 Compared to Year Ended December 31, 2008
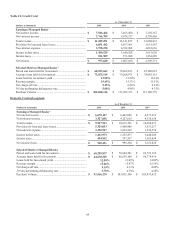
In 2009, the Commercial Banking segment had a net loss of $213.3 million compared to a net income of $254.0 million in 2008.
In 2009, the Commercial Banking segment’s total revenue was $1.3 billion, increasing $210.3 million or 19.0% from 2008. Excluding
Chevy Chase Bank, total revenue increased $144.0 million or 13.0%. Net interest income increased $183.0 million or 19.0% driven by
reduced interest expense on deposits offset by reduced margins in loans; non interest income increased $27.3 million or 18.9% as a
result of growth in treasury management, public finance, and investment banking fees. Excluding Chevy Chase Bank, loan net interest
income increased $117.7 million, or 21.8% from 2008, driven by widening loan margin.
In 2009, the Commercial Banking segment’s average balance for loans held for investment was $30.0 billion, increasing $1.3 billion
or 4.5% from 2008. Excluding Chevy Chase Bank, average balance for loans held for investment was largely flat year over year.
In 2009, the Commercial Banking segment’s average deposit balance was $17.6 billion, increasing $1.0 billion, or 6.1% from 2008.
Excluding Chevy Chase Bank, average deposit balance was largely flat year over year. We initiated greater discipline in deposit
pricing leading to improved deposit margin despite lower balance during this period. As a result, deposit net interest income increased
$40.4 million or 11.3% from 2008.
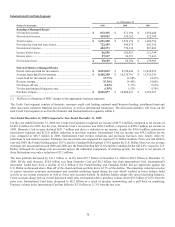
The worsening economy negatively impacted provision and credit metrics in 2009 as collateral values declined and criticized loans
increased. In 2009, the Commercial Banking segment total provision for loans and lease losses for 2009 was $983.4 million,
increasing $749.5 million, or 320.5% from 2008.
The net charge-off rate was 1.45% in 2009, increasing 116 basis points from 2008. Credit losses have been elevated from historical
levels as a result of the economic environment and its impact on our borrowers and collateral values. Net charge-offs totaled $433.9
million in 2009, increasing $350.7 million from 2008. The allowance build increased $395.2 million from 2008, due to significant
credit quality deterioration and decline in collateral values.
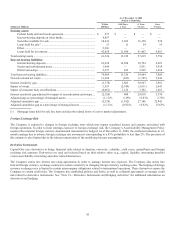
Total non-interest expense for 2009 was $660.8 million, increasing $179.8 million or 37.4% from 2008. Excluding Chevy Chase
Bank, non-interest expense increased $156.6 million or 32.6% from 2008. The year-over-year increase in expenses was largely driven
by investments in our infrastructure and operating model in 2009 and increases in FDIC insurance assessment. Additionally, due to
credit quality deterioration, provision for foreclosed assets and special asset workout expenses increased, contributing to the increase
in non-interest expenses.
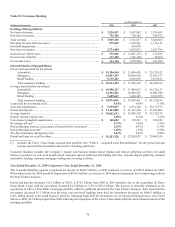
Year Ended December 31, 2008 Compared to Year Ended December 31, 2007
In 2008, the Commercial Banking segment had a net income of $254.0 million, compared to a net income of $457.3 millions in 2007.
Higher provision expense and non-interest expense more than offset revenue growth, driving year-over-year decline of net income.
In 2008, the Commercial Banking segment total revenue was $1,105.6 million, increasing $47.3 million or 4.5% from 2007. Net
interest income increased $30.1 million or 3.2%, largely driven by loan balance growth. Non-interest income increased $17.2 million
or 13.5% as a result of increased fees in treasury management, public finance, and investment banking fees.
In 2008, the Commercial Banking segment average balance for loans held for investment was $28.7 billion, increasing $3.8 billion or
15.3% from 2007. Loan net interest income increased $48.8 million or 9.95% from 2007, driven by loan balance growth across
Commercial Banking businesses offset by rate declines from 6.98% to 5.89%.
In 2008, the Commercial Banking segment average balance for deposits was $16.6 billion, decreasing $859.8 million or 4.9% from
2007. We experienced deposits run-offs in the fourth quarter of 2008 due to market dislocation caused by the economic crisis. As a
result, deposit net interest income declined $18.9 million or 5.3% from 2007.
In 2008, the Commercial Banking segment total provision for loans and lease losses was $233.9 million, increasing $261.7 million
from 2007. The net charge-off rate was 0.29% in 2008, increasing 24 basis points from 2007. Net charge-offs totaled $83.2 million in
2008, increasing $70.0 million from 2007. The allowance build was $150.6 million, increasing $191.5 million from 2007. The year-
over-year increase of allowance build was a result of credit deterioration as well as a change of reserve methodology in 2007. In 2007,
Commercial Bank booked an allowance release of $(40.8) million, as we converted the legacy North Fork Bank’s reserve
methodology to Capital One’s methodology.
In 2008, the Commercial Banking segment total non-interest expense was $481.0 million, increasing $96.3 million or 25.0% over
2007. Expenses increased year-over-year as we started building Commercial Bank’s infrastructure and restructuring our operating
model in 2008.