Capital One 2009 Annual Report Download - page 64
Download and view the complete annual report
Please find page 64 of the 2009 Capital One annual report below. You can navigate through the pages in the report by either clicking on the pages listed below, or by using the keyword search tool below to find specific information within the annual report.-
 1
1 -
2
-
3
-
4
-
5
-
6
-
7
-
8
-
9
-
10
-
11
-
12
-
13
-
14
-
15
-
16
-
17
-
18
-
19
-
20
-
21
-
22
-
23
-
24
-
25
-
26
-
27
-
28
-
29
-
30
-
31
-
32
-
33
-
34
-
35
-
36
-
37
-
38
-
39
-
40
-
41
-
42
-
43
-
44
-
45
-
46
-
47
-
48
-
49
-
50
-
51
-
52
-
53
-
 54
54 -
 55
55 -
 56
56 -
 57
57 -
 58
58 -
 59
59 -
 60
60 -
 61
61 -
 62
62 -
 63
63 -
 64
64 -
 65
65 -
 66
66 -
 67
67 -
 68
68 -
 69
69 -
 70
70 -
 71
71 -
 72
72 -
 73
73 -
 74
74 -
75
-
76
-
77
-
78
-
79
-
80
-
81
-
82
-
83
-
84
-
85
-
86
-
87
-
88
-
89
-
90
-
91
-
92
-
93
-
94
-
95
-
96
-
97
-
98
-
99
-
100
-
101
-
102
-
103
-
104
-
105
-
106
-
107
-
108
-
109
-
110
-
111
-
112
-
113
-
114
-
115
-
116
-
117
-
118
-
119
-
120
-
121
-
122
-
123
-
124
-
125
-
126
-
127
-
128
-
129
-
130
-
131
-
132
-
133
-
134
-
135
-
136
-
137
-
138
-
139
-
140
-
141
-
142
-
143
-
144
-
145
-
146
-
147
-
148
-
149
-
150
-
151
-
152
-
153
-
154
-
155
-
156
-
157
-
158
-
159
-
160
-
161
-
162
-
163
-
164
-
165
-
166
-
167
-
168
-
169
-
170
-
171
-
172
-
173
-
174
-
175
-
176
-
177
-
178
-
179
-
180
-
181
-
182
-
183
-
184
-
185
-
186
-
187
-
188
-
189
-
190
-
191
-
192
-
193
-
194
-
195
-
196
-
197
-
198
-
199
-
200
-
201
-
202
-
203
-
204
-
205
-
206
-
207
-
208
-
209
 |
 |

51
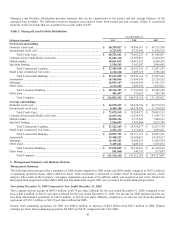
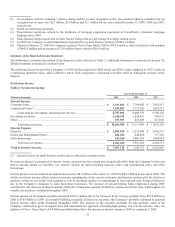
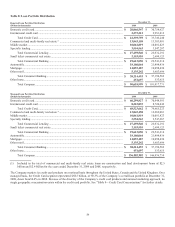
(1) In accordance with the Company’s finance charge and fee revenue recognition policy, the amounts billed to customers but not
recognized as revenue were $2.1 billion, $1.9 billion and $1.1 billion for the years ended December 31, 2009, 2008 and 2007,
respectively.
(2) Based on continuing operations.
(3) Discontinued operations related to the shutdown of mortgage origination operations of GreenPoint’s wholesale mortgage
banking unit in 2007.
(4) Risk adjusted margin equals total revenue less net charge-offs as a percentage of average earning assets.
(5) In 2008, the Company recorded impairment of goodwill in its Auto Finance business of $810.9 million.
(6) Effective February 27, 2009 the Company acquired Chevy Chase Bank, FSB for $475.9 million, which included a cash payment
of $445.0 million and an issuance of 2.56 million shares valued at $30.9 million.
Summary of the Reported Income Statement
The following is a detailed description of the financial results reflected in Table 3. Additional information is provided in Section XI,
Tabular Summary as detailed in sections below.
The following discussion provides a summary of 2009 results compared to 2008 results and 2008 results compared to 2007 results on
a continuing operations basis, unless otherwise noted. Each component is discussed in further detail in subsequent sections of this
analysis.
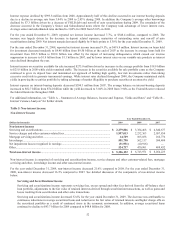
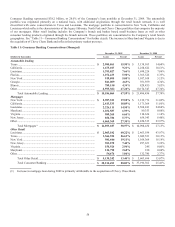
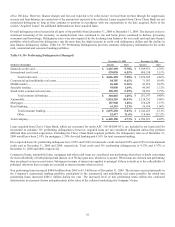
Net Interest Income
Table 4: Net interest income
Year Ended December 31,
(Dollars in thousands)
2009 2008
2007
Interest Income
Consumer loans ......................................................................................................... $ 7,237,013 $ 7,748,642 $ 7,802,817
Commercial loans (1) .................................................................................................. 1,520,053 1,711,736 1,697,311
Loans held for investment, including past-due fees ......................................... 8,757,066 9,460,378 9,500,128
Investment securities ................................................................................................. 1,610,210 1,224,012 950,972
Other .......................................................................................................................... 297,309 427,609 627,056
Total interest income ........................................................................................ $ 10,664,585 $ 11,111,999 $ 11,078,156
Interest Expense
Deposits ..................................................................................................................... $ 2,093,019 $ 2,512,040 $ 2,906,351
Senior and Subordinated Notes ................................................................................. 260,282 444,854 577,128
Other borrowings ....................................................................................................... 614,169 1,006,390 1,064,832
Total interest expense ...................................................................................... 2,967,470 3,963,284 4,548,311
Total net interest income ......................................................................................... $ 7,697,115 $ 7,148,715 $ 6,529,845
(1) Interest income for small business credit cards is reflected in consumer loans.
Net interest income is comprised of interest income and past-due fees earned and deemed collectible from the Company’s loans and
interest income earned on securities, less interest expense on interest-bearing deposits, senior and subordinated notes, and other
borrowings.
Interest income on loans held for investment decreased to $8.8 billion at December 31, 2009 from $9.5 billion at the end of 2008. The
decline in interest income reflects reduced consumer spending due to the current economic conditions as evidenced by the decline in
purchase volume in our Credit Card segment as well as continued declines in outstandings in our Card and Auto Finance businesses
due to the Company’s decisions to scale back those businesses. The increase of non-performing loans experienced during 2009
contributed to the decrease in interest income within the Commercial segment. In addition, declines in interest rates, which impact our
variable rate products, continued throughout 2009.
Interest income on investment securities increased $386.2 million driven by increases in the average portfolio from $25.0 billion in
2008 to $36.9 billion in 2009. As a result of holding a majority of fixed rate securities, the Company’s portfolio continued to generate
interest income while yields fluctuated throughout 2009. The increase in the securities available for sale portfolio came as the
Company continued to grow its deposit base and maintained our approach of holding high quality, low risk investments. Also, the
addition of Chevy Chase Bank’s $1.4 billion portfolio helped drive the increase in interest income in 2009 as compared to 2008.