Capital One 2009 Annual Report Download - page 69
Download and view the complete annual report
Please find page 69 of the 2009 Capital One annual report below. You can navigate through the pages in the report by either clicking on the pages listed below, or by using the keyword search tool below to find specific information within the annual report.-
 1
1 -
2
-
3
-
4
-
5
-
6
-
7
-
8
-
9
-
10
-
11
-
12
-
13
-
14
-
15
-
16
-
17
-
18
-
19
-
20
-
21
-
22
-
23
-
24
-
25
-
26
-
27
-
28
-
29
-
30
-
31
-
32
-
33
-
34
-
35
-
36
-
37
-
38
-
39
-
40
-
41
-
42
-
43
-
44
-
45
-
46
-
47
-
48
-
49
-
50
-
51
-
52
-
53
-
54
-
55
-
56
-
57
-
58
-
 59
59 -
 60
60 -
 61
61 -
 62
62 -
 63
63 -
 64
64 -
 65
65 -
 66
66 -
 67
67 -
 68
68 -
 69
69 -
 70
70 -
 71
71 -
 72
72 -
 73
73 -
 74
74 -
 75
75 -
 76
76 -
 77
77 -
 78
78 -
 79
79 -
80
-
81
-
82
-
83
-
84
-
85
-
86
-
87
-
88
-
89
-
90
-
91
-
92
-
93
-
94
-
95
-
96
-
97
-
98
-
99
-
100
-
101
-
102
-
103
-
104
-
105
-
106
-
107
-
108
-
109
-
110
-
111
-
112
-
113
-
114
-
115
-
116
-
117
-
118
-
119
-
120
-
121
-
122
-
123
-
124
-
125
-
126
-
127
-
128
-
129
-
130
-
131
-
132
-
133
-
134
-
135
-
136
-
137
-
138
-
139
-
140
-
141
-
142
-
143
-
144
-
145
-
146
-
147
-
148
-
149
-
150
-
151
-
152
-
153
-
154
-
155
-
156
-
157
-
158
-
159
-
160
-
161
-
162
-
163
-
164
-
165
-
166
-
167
-
168
-
169
-
170
-
171
-
172
-
173
-
174
-
175
-
176
-
177
-
178
-
179
-
180
-
181
-
182
-
183
-
184
-
185
-
186
-
187
-
188
-
189
-
190
-
191
-
192
-
193
-
194
-
195
-
196
-
197
-
198
-
199
-
200
-
201
-
202
-
203
-
204
-
205
-
206
-
207
-
208
-
209
 |
 |

56
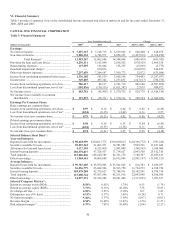
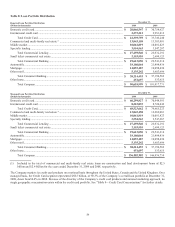
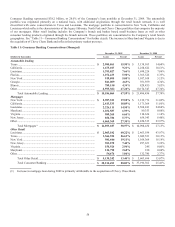
Table 8: Loan Portfolio Distribution
Reported Loan Portfolio Distribution
(Dollars in thousands)
December 31,
2009
2008
Domestic credit card .........................................................................................................................
.
$ 20,066,547 $ 30,754,627
International credit card ....................................................................................................................
.
2,273,212 2,991,613
Total Credit Card .....................................................................................................................
.
$ 22,339,759 $ 33,746,240
Commercial and multi-family real estate (1) ......................................................................................
.
13,843,158 13,303,081
Middle market ...................................................................................................................................
.
10,061,819 10,081,823
Specialty lending ...............................................................................................................................
.
3,554,563 3,547,287
Total Commercial Lending .....................................................................................................
.
$ 27,459,540 $ 26,932,191
Small ticket commercial real estate ..................................................................................................
.
2,153,510 2,609,123
Total Commercial Banking .....................................................................................................
.
$ 29,613,050 $ 29,541,314
Automobile .......................................................................................................................................
.
18,186,064 21,494,436
Mortgage ...........................................................................................................................................
.
14,893,187 10,098,430
Other retail ........................................................................................................................................
.
5,135,242 5,603,696
Total Consumer Banking .........................................................................................................
.
$ 38,214,493 $ 37,196,562
Other loans ........................................................................................................................................
.
451,697 533,655
Total Company ........................................................................................................................
.
$ 90,618,999 $ 101,017,771
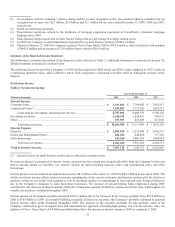
Managed Loan Portfolio Distribution
(Dollars in thousands)
December 31,
2009
2008
Domestic credit card .........................................................................................................................
.
$ 60,299,827 $ 70,944,581
International credit card ....................................................................................................................
.
8,223,835 8,720,642
Total Credit Card .....................................................................................................................
.
$ 68,523,662 $ 79,665,223
Commercial and multi-family real estate (1) .......................................................................................
.
13,843,158 13,303,081
Middle market ...................................................................................................................................
.
10,061,819 10,081,823
Specialty lending ...............................................................................................................................
.
3,554,563 3,547,287
Total Commercial Lending .....................................................................................................
.
$ 27,459,540 $ 26,932,191
Small ticket commercial real estate ..................................................................................................
.
2,153,510 2,609,123
Total Commercial Banking .....................................................................................................
.
$ 29,613,050 $ 29,541,314
Automobile .......................................................................................................................................
.
18,186,064 21,494,436
Mortgage ...........................................................................................................................................
.
14,893,187 10,098,430
Other retail ........................................................................................................................................
.
5,135,242 5,603,696
Total Consumer Banking .........................................................................................................
.
$ 38,214,493 $ 37,196,562
Other loans ........................................................................................................................................
.
451,697 533,655
Total Company ........................................................................................................................
.
$ 136,802,902 $ 146,936,754
(1) Included in the total of commercial and multi-family real estate loans are construction and land development loans of $2.5
billion and $2.4 billion for the years ended December 31, 2009 and 2008, respectively.
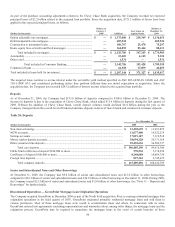
The Company markets its credit card products on a national basis throughout the United States, Canada and the United Kingdom. On a
managed basis, the Credit Card segment represented $68.5 billion, or 50.3% of the Company’s overall loan portfolio at December 31,
2009, down from54.4% in 2008. Because of the diversity of the Company’s credit card products and national marketing approach, no
single geographic concentration exists within the credit card portfolio. See “Table 9—Credit Card Concentrations” for further details.