Capital One 2009 Annual Report Download - page 45
Download and view the complete annual report
Please find page 45 of the 2009 Capital One annual report below. You can navigate through the pages in the report by either clicking on the pages listed below, or by using the keyword search tool below to find specific information within the annual report.-
 1
1 -
2
-
3
-
4
-
5
-
6
-
7
-
8
-
9
-
10
-
11
-
12
-
13
-
14
-
15
-
16
-
17
-
18
-
19
-
20
-
21
-
22
-
23
-
24
-
25
-
26
-
27
-
28
-
29
-
30
-
31
-
32
-
33
-
34
-
 35
35 -
 36
36 -
 37
37 -
 38
38 -
 39
39 -
 40
40 -
 41
41 -
 42
42 -
 43
43 -
 44
44 -
 45
45 -
 46
46 -
 47
47 -
 48
48 -
 49
49 -
 50
50 -
 51
51 -
 52
52 -
 53
53 -
 54
54 -
 55
55 -
56
-
57
-
58
-
59
-
60
-
61
-
62
-
63
-
64
-
65
-
66
-
67
-
68
-
69
-
70
-
71
-
72
-
73
-
74
-
75
-
76
-
77
-
78
-
79
-
80
-
81
-
82
-
83
-
84
-
85
-
86
-
87
-
88
-
89
-
90
-
91
-
92
-
93
-
94
-
95
-
96
-
97
-
98
-
99
-
100
-
101
-
102
-
103
-
104
-
105
-
106
-
107
-
108
-
109
-
110
-
111
-
112
-
113
-
114
-
115
-
116
-
117
-
118
-
119
-
120
-
121
-
122
-
123
-
124
-
125
-
126
-
127
-
128
-
129
-
130
-
131
-
132
-
133
-
134
-
135
-
136
-
137
-
138
-
139
-
140
-
141
-
142
-
143
-
144
-
145
-
146
-
147
-
148
-
149
-
150
-
151
-
152
-
153
-
154
-
155
-
156
-
157
-
158
-
159
-
160
-
161
-
162
-
163
-
164
-
165
-
166
-
167
-
168
-
169
-
170
-
171
-
172
-
173
-
174
-
175
-
176
-
177
-
178
-
179
-
180
-
181
-
182
-
183
-
184
-
185
-
186
-
187
-
188
-
189
-
190
-
191
-
192
-
193
-
194
-
195
-
196
-
197
-
198
-
199
-
200
-
201
-
202
-
203
-
204
-
205
-
206
-
207
-
208
-
209
 |
 |
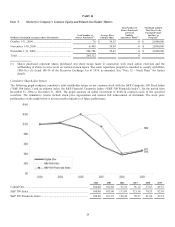
32
For the 2009 annual impairment test, the fair value of reporting units was calculated using a discounted cash flow analysis, a form of
the income approach, using each reporting unit’s internal forecast and a terminal value calculated using a growth rate reflecting the
nominal growth rate of the economy as a whole and appropriate discount rates for the respective reporting units. Cash flows were
adjusted as necessary in order to maintain each reporting unit’s equity capital requirements. Our discounted cash flow analysis
required management to make judgments about future loan and deposit growth, revenue growth, credit losses, and capital rates. The
cash flows were discounted to present value using reporting unit specific discount rates that are largely based on the Company’s
external cost of equity with adjustments for risk inherent in each reporting unit. Discount rates used for the reporting units ranged from
10.0% to 14.3%. The key inputs into the discounted cash flow analysis were corroborated with market data, where available,
indicating that assumptions used were within a reasonable range of observable market data.
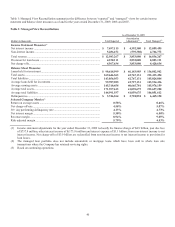
Based on the comparison of fair value to carrying amount, as calculated using the methodology summarized above, fair value
exceeded carrying amount for all reporting units as of the Company’s annual testing date; therefore, the goodwill of those reporting
units was considered not impaired, and the second step of impairment testing was unnecessary. However, if all others factors were
held constant, a 30.36% decline in the fair value of the Domestic Card reporting unit, a 21.67% decline in the fair value the
International Card reporting unit, a 16.72% decline in the fair value of the Auto reporting unit, a 18.98% decline in the fair value of
the Commercial Banking reporting unit and a 28.43% decline in the fair value of the Consumer Banking reporting unit would have
caused the carrying amount for those reporting units to be in excess of fair value which would require the second step to be performed.
As part of the annual impairment test, the Company assessed its market capitalization based on the prior month average market price
relative to the aggregate fair value of its reporting units and determined that the excess fair value in its reporting units at that time
could be attributed to a reasonable control premium. Throughout 2008 and early 2009, the lack of liquidity in the financial markets
and the continued economic deterioration not only led to extreme volatility from period to period but also declines in market
capitalization for many financial service institutions. This resulted in significantly higher control premiums then what was seen
historically. The Company’s control premium has declined throughout the year and we will continue to regularly monitor our market
capitalization in 2010, overall economic conditions and other events or circumstances that might result in an impairment of goodwill
in the future.
Other Intangible Assets
Other intangible assets having finite useful lives are separately recognized and amortized over their estimated useful lives and
reviewed for impairment. An impairment loss is recognized if the carrying amount of the intangible assets is not recoverable and its
carrying amount exceeds its fair value. There were no impairment losses recognized for other intangible assets during the years ended
December 31, 2009, 2008 and 2007. However, amortization of $234.6 million, $200.6 million and $235.1 million was recognized in
2009, 2008, and 2007, respectively.
Revenue Recognition
The Company earns revenue from various sources including lending, securities portfolio, customer deposits and loan servicing. We
also earn revenue from selling loans and securities. Revenue is recognized as it is earned based on contractual terms, as the
transactions occur or services are provided and collectibility is reasonably assured. For credit card loans, when the Company does not
expect full payment of finance charges and fees, it does not accrue the estimated uncollectible portion as income (hereafter the
“suppression amount”). To calculate the suppression amount, the Company first estimates the uncollectible portion of credit card
finance charge and fee receivables using a formula based on an estimate of future non-principal losses. This formula is consistent with
that used to estimate the allowance related to expected principal losses on reported loans. The suppression amount is calculated by
adding any current period change in the estimate of the uncollectible portion of finance charge and fee receivables to the amount of
finance charges and fees charged-off (net of recoveries) during the period. The Company subtracts the suppression amount from the
total finance charges and fees billed during the period to arrive at total reported revenue.
The amount of finance charges and fees suppressed were $2.1 billion, $1.9 billion and $1.1 billion for the years ended December 31,
2009, 2008 and 2007, respectively.