Capital One 2009 Annual Report Download - page 73
Download and view the complete annual report
Please find page 73 of the 2009 Capital One annual report below. You can navigate through the pages in the report by either clicking on the pages listed below, or by using the keyword search tool below to find specific information within the annual report.-
 1
1 -
2
-
3
-
4
-
5
-
6
-
7
-
8
-
9
-
10
-
11
-
12
-
13
-
14
-
15
-
16
-
17
-
18
-
19
-
20
-
21
-
22
-
23
-
24
-
25
-
26
-
27
-
28
-
29
-
30
-
31
-
32
-
33
-
34
-
35
-
36
-
37
-
38
-
39
-
40
-
41
-
42
-
43
-
44
-
45
-
46
-
47
-
48
-
49
-
50
-
51
-
52
-
53
-
54
-
55
-
56
-
57
-
58
-
59
-
60
-
61
-
62
-
 63
63 -
 64
64 -
 65
65 -
 66
66 -
 67
67 -
 68
68 -
 69
69 -
 70
70 -
 71
71 -
 72
72 -
 73
73 -
 74
74 -
 75
75 -
 76
76 -
 77
77 -
 78
78 -
 79
79 -
 80
80 -
 81
81 -
 82
82 -
 83
83 -
84
-
85
-
86
-
87
-
88
-
89
-
90
-
91
-
92
-
93
-
94
-
95
-
96
-
97
-
98
-
99
-
100
-
101
-
102
-
103
-
104
-
105
-
106
-
107
-
108
-
109
-
110
-
111
-
112
-
113
-
114
-
115
-
116
-
117
-
118
-
119
-
120
-
121
-
122
-
123
-
124
-
125
-
126
-
127
-
128
-
129
-
130
-
131
-
132
-
133
-
134
-
135
-
136
-
137
-
138
-
139
-
140
-
141
-
142
-
143
-
144
-
145
-
146
-
147
-
148
-
149
-
150
-
151
-
152
-
153
-
154
-
155
-
156
-
157
-
158
-
159
-
160
-
161
-
162
-
163
-
164
-
165
-
166
-
167
-
168
-
169
-
170
-
171
-
172
-
173
-
174
-
175
-
176
-
177
-
178
-
179
-
180
-
181
-
182
-
183
-
184
-
185
-
186
-
187
-
188
-
189
-
190
-
191
-
192
-
193
-
194
-
195
-
196
-
197
-
198
-
199
-
200
-
201
-
202
-
203
-
204
-
205
-
206
-
207
-
208
-
209
 |
 |

60
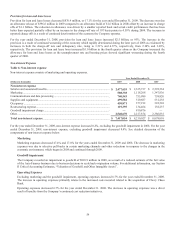
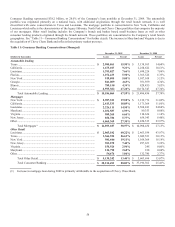
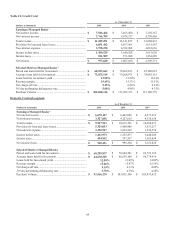
Our commercial real estate and middle market lending products are primarily concentrated in our local banking markets. To date,
these markets have experienced less deterioration in their economic fundamentals than some of the hardest hit regions in the United
States. We believe this has contributed to above average credit performance. Our most significant concentration is commercial real
estate in New York. During 2009, conditions in the New York real estate market deteriorated, particularly residential
construction/redevelopment and Class A office space. Within our $13.8 billion commercial real estate portfolio, $2.4 billion
outstanding relates to real estate construction, of which $1.0 billion is in New York. We have $2.1 billion exposure to New York
office properties, most of which is to Class B and C space. For our non-real estate lending, 32.5% of middle market lending is
concentrated in Louisiana. Table 10: Commercial Banking Concentrations provides additional information on geographic
concentrations.
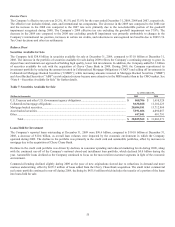
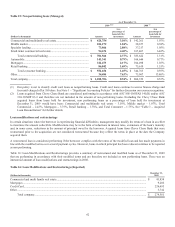
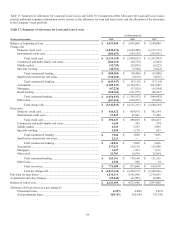
Net Charge-Offs
Net charge-offs include the principal amount of losses (excluding accrued and unpaid finance charges and fees and fraud losses) less
current period principal recoveries. We charge-off credit card loans at 180 days past due from the statement cycle date and charge-off
consumer first lien mortgage loans down to estimated collateral value less cost to sell at 180 days past due. We generally charge-off
other consumer loans at 120 days past the due date or upon repossession of collateral. Bankruptcies charge-off within 30 days of
notification and deceased accounts charge-off within 60 days of notification. Commercial loans are charged-off when the amounts are
deemed uncollectible. Costs to recover previously charged-off accounts are recorded as collection expenses in other non-interest
expense.
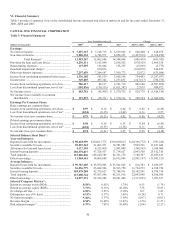
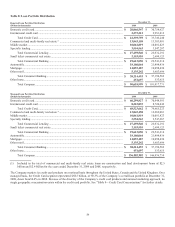
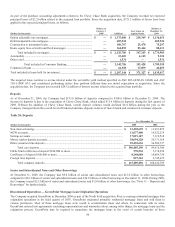
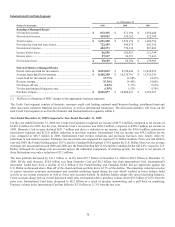
Table 13: Net Charge-Offs
Reported
December 31 Managed
December 31
2009(1) 2008 2007 2009
2008 2007
Credit Card ...............................................................................
.
9.66% 6.61% 4.06% 9.15% 6.26% 4.23%
Commercial Banking (1) ...........................................................
.
1.45% 0.29% 0.05% 1.45% 0.29% 0.05%
Consumer Banking (1) ................................................................
.
2.74% 3.09% 1.94% 2.74% 3.09% 1.94%
Other .........................................................................................
.
37.11% 30.87% 14.05% 37.11% 30.87% 14.05%
Total Company .........................................................................
.
4.58% 3.51% 2.10% 5.87% 4.35% 2.88%
(1) Charge offs for 2009 do not include losses on the loans acquired from Chevy Chase Bank as they are applied against the credit
mark.
For 2009, reported and managed net charge-off rates increased 107 basis points and 152 basis points to 4.58% and 5.87%,
respectively. The increase in both the reported and managed charge-off rates was predominantly due to the continued economic
downturn which persisted during 2009. In particular, commercial charge-offs increased significantly in 2009 due to the general
economic downturn and particularly due to weakness in construction loans, which are included in the commercial and multi-family
real estate portfolio, and in small ticket commercial real estate. The reported charge-off dollars totaled $4.6 billion during 2009, an
increase of 31.3% from 2008. The managed charge-off dollars totaled $8.4 billion, increasing 31.1% from 2008.
For 2008, reported and managed net charge-off rates increased 141 basis points and 147 basis points to 3.51% and 4.35%,
respectively. The increase in both the reported and managed charge-off rates was due to the continued worsening of the economy
which rapidly deteriorated during the second half of 2008. The reported charge-off dollars totaled $3.5 billion during 2008, an increase
of 77.4% from 2007. The managed charge-off dollars totaled $6.4 billion, increasing 54.4% from 2007.
For 2007 reported and managed net charge-off rates decreased 11 basis points to 2.10% and increased 4 basis points to 2.88%,
respectively. The decrease in the reported charge-off rate was impacted by the higher credit quality North Fork loan portfolio for a full
year in 2007 which more than offset the effects of continued consumer credit normalization and economic weakness during the latter
part of 2007. The impacts of the continued credit normalization and economic weakness also had a significant impact on the managed
charge-off rate for the Company’s credit card securitization programs. Year-to-date reported and managed net charge-off dollars
increased 39% and 32%, respectively, compared to the prior year.
Delinquencies and Non performing loans
The Company believes the level of delinquencies and non performing loans to be indicators of loan portfolio credit quality at a point
in time. The entire balance of an account is considered delinquent if the minimum contractually required payment is not received by
the date it is due. Delinquent consumer loans are considered performing loans and accrue interest until 90 days past due for
automobile and mortgage loans and 120 days for other consumer non credit card loans. Commercial loans are placed into non-accrual
when the collection of principal and interest is in doubt. Credit card loans continue to accrue finance charges and fees until charged-