Capital One 2009 Annual Report Download - page 72
Download and view the complete annual report
Please find page 72 of the 2009 Capital One annual report below. You can navigate through the pages in the report by either clicking on the pages listed below, or by using the keyword search tool below to find specific information within the annual report.-
 1
1 -
2
-
3
-
4
-
5
-
6
-
7
-
8
-
9
-
10
-
11
-
12
-
13
-
14
-
15
-
16
-
17
-
18
-
19
-
20
-
21
-
22
-
23
-
24
-
25
-
26
-
27
-
28
-
29
-
30
-
31
-
32
-
33
-
34
-
35
-
36
-
37
-
38
-
39
-
40
-
41
-
42
-
43
-
44
-
45
-
46
-
47
-
48
-
49
-
50
-
51
-
52
-
53
-
54
-
55
-
56
-
57
-
58
-
59
-
60
-
61
-
 62
62 -
 63
63 -
 64
64 -
 65
65 -
 66
66 -
 67
67 -
 68
68 -
 69
69 -
 70
70 -
 71
71 -
 72
72 -
 73
73 -
 74
74 -
 75
75 -
 76
76 -
 77
77 -
 78
78 -
 79
79 -
 80
80 -
 81
81 -
 82
82 -
83
-
84
-
85
-
86
-
87
-
88
-
89
-
90
-
91
-
92
-
93
-
94
-
95
-
96
-
97
-
98
-
99
-
100
-
101
-
102
-
103
-
104
-
105
-
106
-
107
-
108
-
109
-
110
-
111
-
112
-
113
-
114
-
115
-
116
-
117
-
118
-
119
-
120
-
121
-
122
-
123
-
124
-
125
-
126
-
127
-
128
-
129
-
130
-
131
-
132
-
133
-
134
-
135
-
136
-
137
-
138
-
139
-
140
-
141
-
142
-
143
-
144
-
145
-
146
-
147
-
148
-
149
-
150
-
151
-
152
-
153
-
154
-
155
-
156
-
157
-
158
-
159
-
160
-
161
-
162
-
163
-
164
-
165
-
166
-
167
-
168
-
169
-
170
-
171
-
172
-
173
-
174
-
175
-
176
-
177
-
178
-
179
-
180
-
181
-
182
-
183
-
184
-
185
-
186
-
187
-
188
-
189
-
190
-
191
-
192
-
193
-
194
-
195
-
196
-
197
-
198
-
199
-
200
-
201
-
202
-
203
-
204
-
205
-
206
-
207
-
208
-
209
 |
 |

59
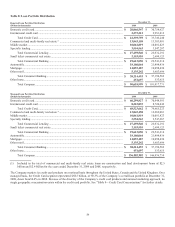
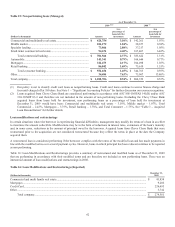
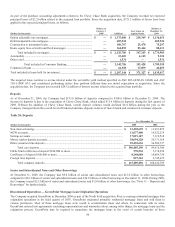
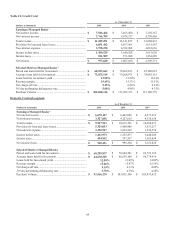
Table 12: Reported Loan Maturity Schedule(1 )
(in thousands)
Amounts due
in one year or
less
Amounts due
after one year
through five
years Amounts due
after five years
Total
Fixed Rate
Total Credit Card ....................................................................... $ 12,510,870 $ 3,377,017 $ — $ 15,887,887
Total Commercial Banking ....................................................... 2,793,762 10,414,144 2,968,980 16,176,886
Automobile ................................................................................ 457,007 14,686,310 3,288,796 18,432,113
Mortgage ................................................................................... 943,078 2,243,638 2,848,239 6,034,955
All other loans ........................................................................... 476,026 2,422,116 4,421,676 7,319,818
Total fixed rate loans........................................................ $ 17,180,743 $ 33,143,225 $ 13,527,691 $ 63,851,659
Variable Rate
Total Credit Card ....................................................................... $ — $ — $ — $ —
Total Commercial Banking ....................................................... 7,464,024 5,068,349 1,037,288 13,569,661
Automobile ................................................................................ — — — —
Mortgage ................................................................................... 1,175,149 233,489 6,375,635 7,784,273
All other loans ........................................................................... 3,380,507 1,761,629 271,270 5,413,406
Total variable loans .......................................................... $ 12,019,680 $ 7,063,467 $ 7,684,193 $ 26,767,340
Total Company loans ................................................................. $ 29,200,423 $ 40,206,692 $ 21,211,884 $ 90,618,999
(1) Please note that the above balances are shown by product type and not by segment.
Credit Risk
Credit Risk is the risk of loss from a borrower’s failure to meet the terms of any contract or failure to otherwise perform as agreed.
There are four primary sources of credit risk: (1) changing economic conditions, which affect borrowers’ ability to pay and the value
of any collateral; (2) a changing competitive environment, which affects customer debt loads, borrowing patterns and loan terms;
(3) our underwriting strategies and standards, which determine to whom we offer credit and on what terms; and (4) the quality of our
internal controls, which establish a process to test that underwriting conforms to our standards and identifies credit quality issues so
we can act upon them in a timely manner.
We have quantitative credit risk guidelines for each of our lines of business. We conduct portfolio and decision level monitoring and
stress tests using economic and legislative stress scenarios. Credit risk objectives are achieved by establishing a credit governance
framework and by establishing policies, procedures, and controls for each step in the credit process. The Board of Directors, Chief
Executive Officer, Chief Risk Officer, Chief Consumer and Commercial Credit Officers, and Division Presidents have specific
accountable roles in the management of credit risk. These include policy approval, creation of credit strategy, review of credit
position, and delegation of authority. Our evolving credit risk position and recommendations to address issues are reviewed by the
Credit Policy Committee and the Board of Directors.
Economic Factors
In evaluating credit risk, the Company considers changing economic conditions and their effects on borrowers’ ability to pay and the
value of any collateral securing the loan. Beginning in mid-2007, economic conditions in the Company’s markets have deteriorated,
with unemployment in the United States reaching 10% at the end of 2009. In addition, asset values, particularly home prices and, more
recently, commercial real estate, have declined substantially. The deterioration in economic conditions during this time period has
created pressure on consumers and businesses to service their debts, resulting in higher levels of delinquencies, charge-offs and
additions to the Company’s allowance for loan and lease losses.
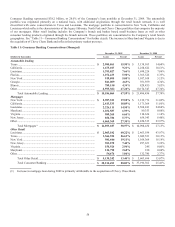
Credit Concentration
The Company believes that diversification of credit is another important element of evaluating credit risk. The Company maintains a
diverse portfolio, offering a broad array of credit products to consumers, small businesses and commercial customers. We think our
consumer portfolios are well diversified nationally and have limited exposure to regional weaknesses. Table 9: Credit Card
Concentrations and Table 11: Consumer Banking Concentrations provide additional information on geographic concentrations of
credit.