Capital One 2009 Annual Report Download - page 71
Download and view the complete annual report
Please find page 71 of the 2009 Capital One annual report below. You can navigate through the pages in the report by either clicking on the pages listed below, or by using the keyword search tool below to find specific information within the annual report.-
 1
1 -
2
-
3
-
4
-
5
-
6
-
7
-
8
-
9
-
10
-
11
-
12
-
13
-
14
-
15
-
16
-
17
-
18
-
19
-
20
-
21
-
22
-
23
-
24
-
25
-
26
-
27
-
28
-
29
-
30
-
31
-
32
-
33
-
34
-
35
-
36
-
37
-
38
-
39
-
40
-
41
-
42
-
43
-
44
-
45
-
46
-
47
-
48
-
49
-
50
-
51
-
52
-
53
-
54
-
55
-
56
-
57
-
58
-
59
-
60
-
 61
61 -
 62
62 -
 63
63 -
 64
64 -
 65
65 -
 66
66 -
 67
67 -
 68
68 -
 69
69 -
 70
70 -
 71
71 -
 72
72 -
 73
73 -
 74
74 -
 75
75 -
 76
76 -
 77
77 -
 78
78 -
 79
79 -
 80
80 -
 81
81 -
82
-
83
-
84
-
85
-
86
-
87
-
88
-
89
-
90
-
91
-
92
-
93
-
94
-
95
-
96
-
97
-
98
-
99
-
100
-
101
-
102
-
103
-
104
-
105
-
106
-
107
-
108
-
109
-
110
-
111
-
112
-
113
-
114
-
115
-
116
-
117
-
118
-
119
-
120
-
121
-
122
-
123
-
124
-
125
-
126
-
127
-
128
-
129
-
130
-
131
-
132
-
133
-
134
-
135
-
136
-
137
-
138
-
139
-
140
-
141
-
142
-
143
-
144
-
145
-
146
-
147
-
148
-
149
-
150
-
151
-
152
-
153
-
154
-
155
-
156
-
157
-
158
-
159
-
160
-
161
-
162
-
163
-
164
-
165
-
166
-
167
-
168
-
169
-
170
-
171
-
172
-
173
-
174
-
175
-
176
-
177
-
178
-
179
-
180
-
181
-
182
-
183
-
184
-
185
-
186
-
187
-
188
-
189
-
190
-
191
-
192
-
193
-
194
-
195
-
196
-
197
-
198
-
199
-
200
-
201
-
202
-
203
-
204
-
205
-
206
-
207
-
208
-
209
 |
 |

58
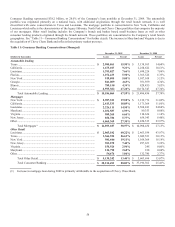
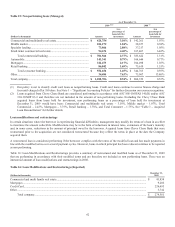
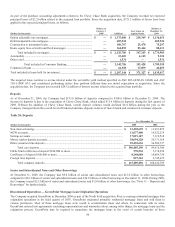
Consumer Banking represented $38.2 billion, or 28.0% of the Company’s loan portfolio at December 31, 2009. The automobile
portfolio was originated primarily on a national basis, with additional originations through the retail branch network. It is well
diversified with some concentration in Texas and Louisiana. The mortgage portfolio is concentrated in New York, California and
Louisiana which reflects the characteristics of the legacy Hibernia, North Fork and Chevy Chase portfolios that comprise the majority
of our mortgages. Other retail lending includes the Company’s branch and banker based small business loans as well as other
consumer lending products originated through the branch network. These portfolios are concentrated in the Company’s retail branch
geographies. See “Table 11—Consumer Banking Concentrations” for further details. The increase in Maryland and Virginia is due to
the acquisition of Chevy Chase Bank and reflects their primary market presence.
Table 11: Consumer Banking Concentrations (Managed)
December 31, 2009 December 31, 2008
(Dollars in thousands)
Loans Percent
Loans Percent
A
utomobile lendin
g
Texas ............................................................................................................ $ 2,900,861 15.95% $ 3,138,103 14.60%
California ..................................................................................................... 1,675,107 9.21% 2,258,622 10.51%
Louisiana ..................................................................................................... 1,393,027 7.66% 1,690,226 7.86%
Florida .......................................................................................................... 1,072,433 5.90% 1,365,526 6.35%
N
ew Yor
k
.................................................................................................... 919,095 5.05% 1,107,018 5.15%
Georgia ........................................................................................................ 841,009 4.63% 931,939 4.34%
Illinois .......................................................................................................... 789,150 4.34% 828,455 3.85%
Other ............................................................................................................ 8,595,382 47.26% 10,174,547 47.34%
Total Automobile Lending ................................................................. $ 18,186,064 47.59% $ 21,494,436 57.79%
M
ort
g
a
g
es
N
ew Yor
k
.................................................................................................... $ 2,907,533 19.52% $ 3,139,776 31.09%
California ..................................................................................................... 2,813,533 18.89% 1,171,364 11.60%
Louisiana ..................................................................................................... 2,226,111 14.95% 2,508,243 24.84%
Maryland ...................................................................................................... 1,032,587 6.93% 89,353 0.88%
Virginia ........................................................................................................ 989,268 6.64% 114,636 1.14%
N
ew Jerse
y
................................................................................................... 858,786 5.77% 654,543 6.48%
Other ............................................................................................................ 4,065,369 27.30% 2,420,515 23.97%
Total Mortgages(1) .............................................................................. $ 14,893,187 38.97% $ 10,098,430 27.15%
Other Retail
Louisiana ..................................................................................................... $ 2,065,182 40.22% $ 2,463,934 43.97%
Texas ............................................................................................................ 1,366,354 26.61% 1,689,531 30.15%
N
ew Yor
k
.................................................................................................... 981,446 19.11% 1,019,364 18.19%
N
ew Jerse
y
................................................................................................... 381,870 7.44% 297,651 5.32%
Virginia ........................................................................................................ 150,924 2.94% 248 0.00%
Maryland ...................................................................................................... 134,790 2.62% 188 0.00%
Other ............................................................................................................ 54,676 1.06% 132,780 2.37%
Total Other Retail ............................................................................... $ 5,135,242 13.44% $ 5,603,696 15.07%
Total Consumer Banking ................................................................... $ 38,214,493 28.03% $ 37,196,562 25.41%
(1) Increase in mortgage loan during 2009 is primarily attributable to the acquisition of Chevy Chase Bank.