Capital One 2009 Annual Report Download - page 12
Download and view the complete annual report
Please find page 12 of the 2009 Capital One annual report below. You can navigate through the pages in the report by either clicking on the pages listed below, or by using the keyword search tool below to find specific information within the annual report.-
 1
1 -
 2
2 -
 3
3 -
 4
4 -
 5
5 -
 6
6 -
 7
7 -
 8
8 -
 9
9 -
 10
10 -
 11
11 -
 12
12 -
 13
13 -
 14
14 -
 15
15 -
 16
16 -
 17
17 -
 18
18 -
 19
19 -
 20
20 -
 21
21 -
 22
22 -
23
-
24
-
25
-
26
-
27
-
28
-
29
-
30
-
31
-
32
-
33
-
34
-
35
-
36
-
37
-
38
-
39
-
40
-
41
-
42
-
43
-
44
-
45
-
46
-
47
-
48
-
49
-
50
-
51
-
52
-
53
-
54
-
55
-
56
-
57
-
58
-
59
-
60
-
61
-
62
-
63
-
64
-
65
-
66
-
67
-
68
-
69
-
70
-
71
-
72
-
73
-
74
-
75
-
76
-
77
-
78
-
79
-
80
-
81
-
82
-
83
-
84
-
85
-
86
-
87
-
88
-
89
-
90
-
91
-
92
-
93
-
94
-
95
-
96
-
97
-
98
-
99
-
100
-
101
-
102
-
103
-
104
-
105
-
106
-
107
-
108
-
109
-
110
-
111
-
112
-
113
-
114
-
115
-
116
-
117
-
118
-
119
-
120
-
121
-
122
-
123
-
124
-
125
-
126
-
127
-
128
-
129
-
130
-
131
-
132
-
133
-
134
-
135
-
136
-
137
-
138
-
139
-
140
-
141
-
142
-
143
-
144
-
145
-
146
-
147
-
148
-
149
-
150
-
151
-
152
-
153
-
154
-
155
-
156
-
157
-
158
-
159
-
160
-
161
-
162
-
163
-
164
-
165
-
166
-
167
-
168
-
169
-
170
-
171
-
172
-
173
-
174
-
175
-
176
-
177
-
178
-
179
-
180
-
181
-
182
-
183
-
184
-
185
-
186
-
187
-
188
-
189
-
190
-
191
-
192
-
193
-
194
-
195
-
196
-
197
-
198
-
199
-
200
-
201
-
202
-
203
-
204
-
205
-
206
-
207
-
208
-
209
 |
 |
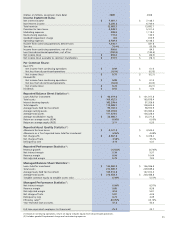
(Dollars in millions, except per share data) 2009 2008
Income Statement Data:
Net interest income $ 7,697.1 $ 7,148.7
Non-interest income 5,286.2 6,744.0
Total revenue 12,983.3 13,892.7
Provision for loan losses 4,230.1 5,101.0
Marketing expenses 588.3 1,118.2
Restructuring expenses 119.4 134.5
Goodwill impairment charge 0.0 810.9
Operating expenses 6,709.4 6,146.5
Income from continuing operations before taxes 1,336.1 581.6
Tax rate 35.4% 85.5%
Income from continuing operations, net of tax 986.6 84.5
Loss from discontinued operations, net of tax (102.8) (130.5)
Net income (loss) $ 883.8 $ (46.0)
Net income (loss) available to common shareholders $ 319.9 $ (78.7)
Per Common Share:
Basic EPS:
Net income from continuing operations $ 0.99 $ 0.14
Net loss from discontinued operations (0.24) (0.35)
Net income (loss) $ 0.75 $ (0.21)
Diluted EPS:
Net income from continuing operations $ 0.98 $ 0.14
Net loss from discontinued operations (0.24) (0.35)
Net income (loss) $ 0.74 (0.21)
Dividends $ 0.53 $ 1.50
Reported Balance Sheet Statistics(1):
Loans held for investment $ 90,619.0 $ 101,017.8
Total assets 169,622.5 165,878.4
Interest-bearing deposits 102,370.4 97,326.9
Total deposits 115,809.1 108,620.8
Average loans held for investment 99,787.3 98,970.9
Average earning assets 145,293.0 133,083.6
Average total assets 171,573.6 156,226.4
Average stockholders’ equity $ 26,605.7 $ 25,277.8
Return on average assets (ROA) 0.58% 0.05%
Return on average equity (ROE) 3.71 0.33
Reported Asset Quality Statistics(1):
Allowance for loan losses $ 4,127.4 $ 4,524.0
Allowance as a % of reported loans held for investment 4.55% 4.48%
Net charge-offs $ 4,567.6 $ 3,478.2
Net charge-off rate 4.58% 3.51%
Delinquency rate 4.13 4.37
Reported Performance Statistics(1):
Revenue growth (6.55)% (4.74)%
Net interest margin 5.30 5.37
Revenue margin 8.94 10.44
Risk-adjusted margin 5.79 7.83
Managed Balance Sheet Statistics(1):
Loans held for investment $ 136,802.9 $ 146,936.8
Total assets 212,389.7 209,839.6
Average loans held for investment 143,514.4 147,812.3
Average total assets $ 212,633.3 $ 203,488.8
Tangible common equity to tangible assets ratio 6.30% 5.57%
Managed Performance Statistics(1):
Net interest margin 6.50% 6.37%
Revenue margin 9.05 9.39
Risk-adjusted margin 4.53 5.81
Net charge-off rate 5.87 4.35
Delinquency rate 4.73 4.49
Efficiency ratio(2) 43.35% 43.14%
Year-end total loan accounts 37.8 45.4
Full-time equivalent employees (in thousands) 25.9 23.7
(1) Based on continuing operations, return on equity includes equity from discontinued operations.
(2) Excludes goodwill impairment charge and restructuring expenses. 11