Capital One 2009 Annual Report Download - page 88
Download and view the complete annual report
Please find page 88 of the 2009 Capital One annual report below. You can navigate through the pages in the report by either clicking on the pages listed below, or by using the keyword search tool below to find specific information within the annual report.-
 1
1 -
2
-
3
-
4
-
5
-
6
-
7
-
8
-
9
-
10
-
11
-
12
-
13
-
14
-
15
-
16
-
17
-
18
-
19
-
20
-
21
-
22
-
23
-
24
-
25
-
26
-
27
-
28
-
29
-
30
-
31
-
32
-
33
-
34
-
35
-
36
-
37
-
38
-
39
-
40
-
41
-
42
-
43
-
44
-
45
-
46
-
47
-
48
-
49
-
50
-
51
-
52
-
53
-
54
-
55
-
56
-
57
-
58
-
59
-
60
-
61
-
62
-
63
-
64
-
65
-
66
-
67
-
68
-
69
-
70
-
71
-
72
-
73
-
74
-
75
-
76
-
77
-
 78
78 -
 79
79 -
 80
80 -
 81
81 -
 82
82 -
 83
83 -
 84
84 -
 85
85 -
 86
86 -
 87
87 -
 88
88 -
 89
89 -
 90
90 -
 91
91 -
 92
92 -
 93
93 -
 94
94 -
 95
95 -
 96
96 -
 97
97 -
 98
98 -
99
-
100
-
101
-
102
-
103
-
104
-
105
-
106
-
107
-
108
-
109
-
110
-
111
-
112
-
113
-
114
-
115
-
116
-
117
-
118
-
119
-
120
-
121
-
122
-
123
-
124
-
125
-
126
-
127
-
128
-
129
-
130
-
131
-
132
-
133
-
134
-
135
-
136
-
137
-
138
-
139
-
140
-
141
-
142
-
143
-
144
-
145
-
146
-
147
-
148
-
149
-
150
-
151
-
152
-
153
-
154
-
155
-
156
-
157
-
158
-
159
-
160
-
161
-
162
-
163
-
164
-
165
-
166
-
167
-
168
-
169
-
170
-
171
-
172
-
173
-
174
-
175
-
176
-
177
-
178
-
179
-
180
-
181
-
182
-
183
-
184
-
185
-
186
-
187
-
188
-
189
-
190
-
191
-
192
-
193
-
194
-
195
-
196
-
197
-
198
-
199
-
200
-
201
-
202
-
203
-
204
-
205
-
206
-
207
-
208
-
209
 |
 |
75
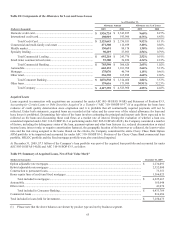
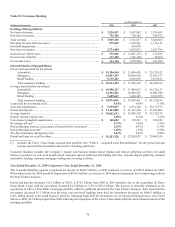
Total revenue increased by 7.2% or $269.1 million to $4.0 billion in 2009. The acquisition of the Chevy Chase Bank portfolio during
2009 drove the majority of the increase. Average loan volumes in the Auto Finance business for the period were $3.5 billion or 15%
lower than the prior year, yet the impact to revenues was muted. A favorable interest rate environment and improved pricing power in
the marketplace resulted in higher net interest margins for the Auto Finance business. Retail banking revenues increased primarily due
to the acquisition of Chevy Chase Bank. Adjusting for the acquisition, revenues have remained relatively flat over the prior year. We
have shifted our focus towards improving deposit margins and growing core banking relationships, allowing certain high rate non-
relational deposits to run off. Additionally, the deposit mix has shifted from time deposits due to the low rate environment to liquid
alternatives like savings and money market. Revenue from the Mortgage business was relatively flat over the prior year, as the
acquisition of Chevy Chase bank mortgage portfolio was partially offset by the valuation adjustments for our mortgage servicing
rights and changes to valuations of the securities on the Chevy Chase Bank securitized portfolio.
Provision for loan and lease losses declined $658.6 million or 42.9% from 2008 to $875.6 million in 2009. During this same time
period, the net charge-off rate decreased from 3.09% to 2.74%. Improving losses and a shrinking portfolio in the Auto Finance
business were the primary drivers, offset by higher allowance builds in the Retail Banking business. The net charge-off rate in the
Auto Finance business improved to 4.37% from 4.59% even as loan volumes decreased during the same time period. The favorability
was driven by the growing portfolio share of newer, lower risk originations from 2008 and 2009, on-going improvement in the
industry due to recovery in auction prices and consumers elevating auto in their payment hierarchy. Additionally we are investing in
building stronger dealer relationships as well as loss mitigation strategies that help reduce charge-offs and loss severity. The Retail
Banking business saw an increase in net charge-off rate from 1.89% in 2008 to 2.53%. This reflects the general economic trends of the
worsening unemployment rate and other economic factors. Mortgage reflects an increase in net charge-off rate from 0.35% in 2008 to
0.58% for 2009. Delinquency and loss rates continued to climb throughout 2009 in line with industry trends. The assets that were
acquired as part of the Chevy Chase Bank acquisition continue to perform in line with initial our expectations, and therefore the
Company has not recorded an additional allowance as of December 31, 2009. All losses are applied against credit mark and do not
impact reported charge offs or allowance.
In 2009, non-interest expense increased to $2.7 billion, an increase of $281.8 million or 11.5% from the previous year. The increase in
non-interest expenses was driven by Chevy Chase acquisition and investment in the mortgage business.
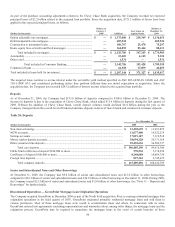
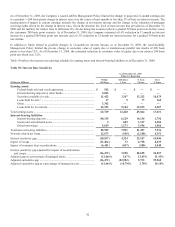
Year Ended December 31, 2008 Compared to Year Ended December 31, 2007
In 2008, the Consumer Banking segment recognized a net loss of $980.0 million, compared to net income of $101.9 million in 2007.
Excluding the impact of 810.9 million goodwill impairment incurred in 2008, the Auto Finance business recognized a net loss of
$154.5 million in 2008, driven primarily by higher provision for loan losses due to the worsening economy and declining auto auction
prices.
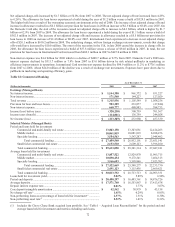
Period end deposits increased $4.1 billion to $61.8 billion in 2008 due to growth in the national direct and consumer branch deposits
in the Retail Banking business. Period end loans held for investment decreased $5.2 billion from 2007 to 2008 for the Consumer
Banking segment. Auto Finance loans held for investment decreased $3.6 billion to $21.5 billion for 2008 due to a pull back in
originations as the business focused on its most resilient segments during an economically challenging climate. Loans held for
investment in the Mortgage business decreased $1.5 billion to $10.1 billion for 2008, reflecting a runoff in the residential mortgage
portfolio.
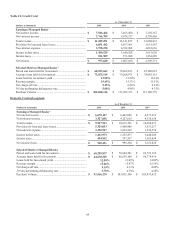
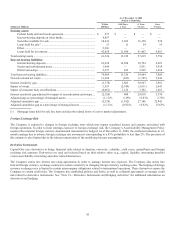
Total revenue decreased by 3.2% or $123.9 million to $3.7 billion for 2008. Revenue in the Auto Finance business declined in 2008,
primarily due to a decline in loans held for investment. In the Retail Banking business, an increase in net interest margin on deposits
and loans slightly offset the decrease in the total Consumer Banking segment. Revenue in the Mortgage business was lower than 2007,
as mortgage originations and loans decreased significantly due to industry-wide challenges in the market. Additionally, lower gain on
sale revenue and servicing income drove revenues lower.
Provision for loan and lease losses increased $418.1 million or 37.5% to $1.5 billion from 2007 to 2008, reflecting the general
deterioration in the economy during 2008. During this same time period, the Consumer Banking net charge-off rate increased from
1.96% to 3.09%. During 2008, the Auto business’s net charge-off rate was 4.59%, up 153 basis points from 3.06% during 2007. Net
charge-offs increased $338.2 million, or 45.7%, while average loans outstanding during 2008 declined $660.2 million, or 2.7%,
compared to 2007. The worsening economy and the general conditions surrounding the auto industry in 2008 was the primary driver
of higher loss rates in 2008. Similarly, the Retail Banking business experienced an increase in charge-offs due to economic factors that
negatively impacted borrowers’ ability to repay.
In 2008, non-interest expense decreased $115.2 million or 4.5% to $2.5 billion, driven by the Auto Finance business. The pull back in
the Auto business resulted in reductions in origination and servicing related expenses. Smaller variances in the Retail Banking and
Mortgage businesses offset one another.