Capital One 2009 Annual Report Download - page 77
Download and view the complete annual report
Please find page 77 of the 2009 Capital One annual report below. You can navigate through the pages in the report by either clicking on the pages listed below, or by using the keyword search tool below to find specific information within the annual report.-
 1
1 -
2
-
3
-
4
-
5
-
6
-
7
-
8
-
9
-
10
-
11
-
12
-
13
-
14
-
15
-
16
-
17
-
18
-
19
-
20
-
21
-
22
-
23
-
24
-
25
-
26
-
27
-
28
-
29
-
30
-
31
-
32
-
33
-
34
-
35
-
36
-
37
-
38
-
39
-
40
-
41
-
42
-
43
-
44
-
45
-
46
-
47
-
48
-
49
-
50
-
51
-
52
-
53
-
54
-
55
-
56
-
57
-
58
-
59
-
60
-
61
-
62
-
63
-
64
-
65
-
66
-
 67
67 -
 68
68 -
 69
69 -
 70
70 -
 71
71 -
 72
72 -
 73
73 -
 74
74 -
 75
75 -
 76
76 -
 77
77 -
 78
78 -
 79
79 -
 80
80 -
 81
81 -
 82
82 -
 83
83 -
 84
84 -
 85
85 -
 86
86 -
 87
87 -
88
-
89
-
90
-
91
-
92
-
93
-
94
-
95
-
96
-
97
-
98
-
99
-
100
-
101
-
102
-
103
-
104
-
105
-
106
-
107
-
108
-
109
-
110
-
111
-
112
-
113
-
114
-
115
-
116
-
117
-
118
-
119
-
120
-
121
-
122
-
123
-
124
-
125
-
126
-
127
-
128
-
129
-
130
-
131
-
132
-
133
-
134
-
135
-
136
-
137
-
138
-
139
-
140
-
141
-
142
-
143
-
144
-
145
-
146
-
147
-
148
-
149
-
150
-
151
-
152
-
153
-
154
-
155
-
156
-
157
-
158
-
159
-
160
-
161
-
162
-
163
-
164
-
165
-
166
-
167
-
168
-
169
-
170
-
171
-
172
-
173
-
174
-
175
-
176
-
177
-
178
-
179
-
180
-
181
-
182
-
183
-
184
-
185
-
186
-
187
-
188
-
189
-
190
-
191
-
192
-
193
-
194
-
195
-
196
-
197
-
198
-
199
-
200
-
201
-
202
-
203
-
204
-
205
-
206
-
207
-
208
-
209
 |
 |

64
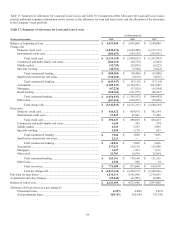
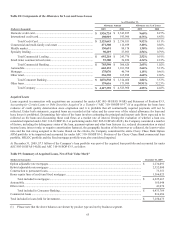
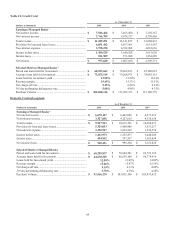
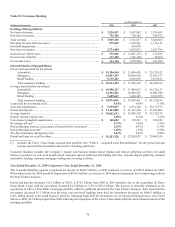
Table 17: Summary of Allowance for Loan and Lease Losses and Table 18: Components of the Allowance for Loan and Lease Losses
provide additional summary information on the activity in the allowance for loan and lease losses and the allocation of the allowance
to the Company’s loan portfolio.
Table 17: Summary of Allowance for Loan and Lease Losses
As of December 31,
(Dollars in thousands)
2009 2008
2007
Balance at beginning of year .............................................................................. $ 4,523,960 $ 2,963,000 $ 2,180,000
Charge-offs
Domestic credit card ................................................................................. (3,049,676) (2,244,488) (1,315,172)
International credit card ............................................................................ (284,453) (255,145) (252,691)
Total credit card .............................................................................. $ (3,334,129) $ (2,499,633) $ (1,567,863)
Commercial and multi-family real estate ................................................. (208,163) (46,755) (2,463)
Middle market .......................................................................................... (52,759) (22,035) (6,223)
Specialty lending ...................................................................................... (48,761) (9,706) (3,812)
Total commercial lending ............................................................... $ (309,683) $ (78,496) $ (12,498)
Small ticket commercial real estate .......................................................... (134,264) (8,619) (4,616)
Total commercial banking .............................................................. $ (443,947) $ (87,115) $ (17,114)
Automobile ............................................................................................... (1,109,347) (1,236,251) (865,881)
Mortgages ................................................................................................. (87,226) (37,926) (18,394)
Retail banking .......................................................................................... (160,364) (121,375) (80,367)
Total consumer banking .................................................................. $ (1,356,937) $ (1,395,552) $ (964,642)
Other loans ............................................................................................... (207,010) (168,931) (30,600)
Total charge-offs ............................................................................. $ (5,342,023) $ (4,151,231) $ (2,580,219)
Recoveries
Domestic credit card ................................................................................. $ 446,822 $ 424,979 $ 392,544
International credit card ............................................................................ 51,825 65,041 71,869
Total credit card .............................................................................. $ 498,647 $ 490,020 $ 464,413
Commercial and multi-family real estate ................................................. 1,645 295 234
Middle market .......................................................................................... 2,923 2,397 2,995
Specialty lending ...................................................................................... 3,360 1,176 667
Total commercial lending ............................................................... $ 7,928 $ 3,868 $ 3,896
Small ticket commercial real estate .......................................................... 2,113 — —
Total commercial banking .............................................................. $ 10,041 $ 3,868 $ 3,896
Automobile ............................................................................................... 237,831 158,159 125,990
Mortgages ................................................................................................. 3,627 1,472 3,311
Other retail ................................................................................................ 21,703 18,559 22,054
Total consumer banking .................................................................. $ 263,161 $ 178,190 $ 151,355
Other loans ............................................................................................... 2,540 982 14
Total recoveries............................................................................... $ 774,389 $ 673,060 $ 619,678
Total net charge-offs ....................................................................... $ (4,567,634) $ (3,478,171) $ (1,960,541)
Provision for loan losses .................................................................................... 4,230,111 5,101,040 2,716,653
Acquisitions and other changes .......................................................................... (59,042) (61,909) 26,888
Balance at end of year ........................................................................................ $ 4,127,395 $ 4,523,960 $ 2,963,000
Allowance for loan losses as a percentage of:
Period-end loans ....................................................................................... 4.55% 4.48% 2.91%
Non-performing loans .............................................................................. 320.74% 562.44% 753.34%