Capital One 2009 Annual Report Download - page 179
Download and view the complete annual report
Please find page 179 of the 2009 Capital One annual report below. You can navigate through the pages in the report by either clicking on the pages listed below, or by using the keyword search tool below to find specific information within the annual report.-
 1
1 -
2
-
3
-
4
-
5
-
6
-
7
-
8
-
9
-
10
-
11
-
12
-
13
-
14
-
15
-
16
-
17
-
18
-
19
-
20
-
21
-
22
-
23
-
24
-
25
-
26
-
27
-
28
-
29
-
30
-
31
-
32
-
33
-
34
-
35
-
36
-
37
-
38
-
39
-
40
-
41
-
42
-
43
-
44
-
45
-
46
-
47
-
48
-
49
-
50
-
51
-
52
-
53
-
54
-
55
-
56
-
57
-
58
-
59
-
60
-
61
-
62
-
63
-
64
-
65
-
66
-
67
-
68
-
69
-
70
-
71
-
72
-
73
-
74
-
75
-
76
-
77
-
78
-
79
-
80
-
81
-
82
-
83
-
84
-
85
-
86
-
87
-
88
-
89
-
90
-
91
-
92
-
93
-
94
-
95
-
96
-
97
-
98
-
99
-
100
-
101
-
102
-
103
-
104
-
105
-
106
-
107
-
108
-
109
-
110
-
111
-
112
-
113
-
114
-
115
-
116
-
117
-
118
-
119
-
120
-
121
-
122
-
123
-
124
-
125
-
126
-
127
-
128
-
129
-
130
-
131
-
132
-
133
-
134
-
135
-
136
-
137
-
138
-
139
-
140
-
141
-
142
-
143
-
144
-
145
-
146
-
147
-
148
-
149
-
150
-
151
-
152
-
153
-
154
-
155
-
156
-
157
-
158
-
159
-
160
-
161
-
162
-
163
-
164
-
165
-
166
-
167
-
168
-
 169
169 -
 170
170 -
 171
171 -
 172
172 -
 173
173 -
 174
174 -
 175
175 -
 176
176 -
 177
177 -
 178
178 -
 179
179 -
 180
180 -
 181
181 -
 182
182 -
 183
183 -
 184
184 -
 185
185 -
 186
186 -
 187
187 -
 188
188 -
 189
189 -
190
-
191
-
192
-
193
-
194
-
195
-
196
-
197
-
198
-
199
-
200
-
201
-
202
-
203
-
204
-
205
-
206
-
207
-
208
-
209
 |
 |

166
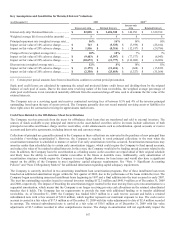
The gain on sale recorded from off-balance sheet securitizations is based on the estimated fair value of the assets sold and retained and
liabilities incurred, and is recorded at the time of sale, net of transaction costs, in servicing and securitizations income on the
Consolidated Statement of Income. The related receivable is the interest-only strip, which is based on the present value of the
estimated future cash flows from excess finance charges and past-due fees over the sum of the return paid to security holders,
estimated contractual servicing fees and credit losses. The Company periodically reviews the key assumptions and estimates used in
determining the value of the interest-only strip and other retained interests. The Company classifies the interest-only strip as a trading
asset. The Company recognizes all changes in the fair value of the interest-only strip immediately in servicing and securitizations
income on the Consolidated Statement of Income. The interest component of cash flows attributable to retained interests in
securitizations is recorded in other interest income.
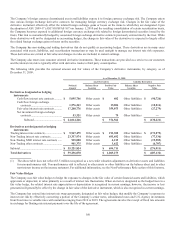
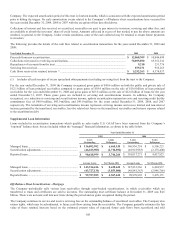
Upon adoption of ASU 2009-16 and ASU 2009-17, the Company expects that predominately all credit card and installment loans that
have been securitized and accounted for as a sale will be subject to consolidation and accounted for as a secured borrowing.
Accordingly, effective January 1, 2010, securitization trusts that contain approximately $47.6 billion of credit card and other consumer
loans and the corresponding securities issued to third party investors are expected to be consolidated at their carrying values. The
retained interests related to these newly consolidated trusts are expected to be eliminated or reclassified as loan receivables, accrued
interest or restricted cash in consolidation, see “Note 1- Significant Accounting Policies” for expected financial statement impact.
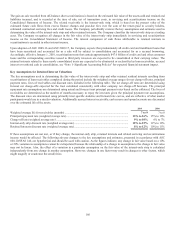
Key Assumptions for Retained Interest Valuations
The key assumptions used in determining the fair value of the interest-only strip and other retained residual interests resulting from
securitizations of loan receivables completed during the period include the weighted average ranges for net charge-off rates, principal
payment rates, lives of receivables and discount rates included in the following table. The net charge-off rates are determined using
forecast net charge-offs expected for the trust calculated consistently with other company net charge-off forecasts. The principal
repayment rate assumptions are determined using actual and forecast trust principal payment rates based on the collateral. The lives of
receivables are determined as the number of months necessary to repay the investors given the principal payment rate assumptions.
The discount rates are determined using primarily trust specific statistics and forward rate curves, and are reflective of what market
participants would use in a similar valuation. Additionally accrued interest receivable, cash reserve and spread accounts are discounted
over the estimated life of the assets.
2009
2008
Weighted average life for receivables (months) ........................................................................................ 7 to 9 7 to 8
Principal repayment rate (weighted average rate) ...................................................................................... 13% to 16% 15% to 16%
Charge-off rate (weighted average rate) .................................................................................................... 9% to 10% 6% to 7%
Interest-only strip discount rate (weighted average rate) ........................................................................... 12% to 15% 12% to 18%
Retained Interests discount rate (weighted average rate) ........................................................................... 8% to 12% 10% to 15%
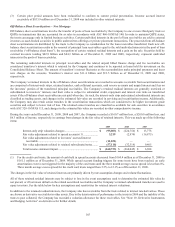
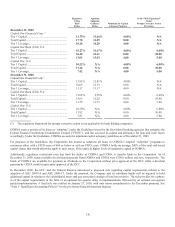
If these assumptions are not met, or if they change, the interest-only strip, retained interests and related servicing and securitizations
income would be affected. The following adverse changes to the key assumptions and estimates, presented in accordance with ASC
860-10/SFAS 140, are hypothetical and should be used with caution. As the figures indicate, any change in fair value based on a 10%
or 20% variation in assumptions cannot be extrapolated because the relationship of a change in assumption to the change in fair value
may not be linear. Also, the effect of a variation in a particular assumption on the fair value of the interest-only strip is calculated
independently from any change in another assumption. However, changes in one factor may result in changes in other factors, which
might magnify or counteract the sensitivities.