Capital One 2009 Annual Report Download - page 101
Download and view the complete annual report
Please find page 101 of the 2009 Capital One annual report below. You can navigate through the pages in the report by either clicking on the pages listed below, or by using the keyword search tool below to find specific information within the annual report.-
 1
1 -
2
-
3
-
4
-
5
-
6
-
7
-
8
-
9
-
10
-
11
-
12
-
13
-
14
-
15
-
16
-
17
-
18
-
19
-
20
-
21
-
22
-
23
-
24
-
25
-
26
-
27
-
28
-
29
-
30
-
31
-
32
-
33
-
34
-
35
-
36
-
37
-
38
-
39
-
40
-
41
-
42
-
43
-
44
-
45
-
46
-
47
-
48
-
49
-
50
-
51
-
52
-
53
-
54
-
55
-
56
-
57
-
58
-
59
-
60
-
61
-
62
-
63
-
64
-
65
-
66
-
67
-
68
-
69
-
70
-
71
-
72
-
73
-
74
-
75
-
76
-
77
-
78
-
79
-
80
-
81
-
82
-
83
-
84
-
85
-
86
-
87
-
88
-
89
-
90
-
 91
91 -
 92
92 -
 93
93 -
 94
94 -
 95
95 -
 96
96 -
 97
97 -
 98
98 -
 99
99 -
 100
100 -
 101
101 -
 102
102 -
 103
103 -
 104
104 -
 105
105 -
 106
106 -
 107
107 -
 108
108 -
 109
109 -
 110
110 -
 111
111 -
112
-
113
-
114
-
115
-
116
-
117
-
118
-
119
-
120
-
121
-
122
-
123
-
124
-
125
-
126
-
127
-
128
-
129
-
130
-
131
-
132
-
133
-
134
-
135
-
136
-
137
-
138
-
139
-
140
-
141
-
142
-
143
-
144
-
145
-
146
-
147
-
148
-
149
-
150
-
151
-
152
-
153
-
154
-
155
-
156
-
157
-
158
-
159
-
160
-
161
-
162
-
163
-
164
-
165
-
166
-
167
-
168
-
169
-
170
-
171
-
172
-
173
-
174
-
175
-
176
-
177
-
178
-
179
-
180
-
181
-
182
-
183
-
184
-
185
-
186
-
187
-
188
-
189
-
190
-
191
-
192
-
193
-
194
-
195
-
196
-
197
-
198
-
199
-
200
-
201
-
202
-
203
-
204
-
205
-
206
-
207
-
208
-
209
 |
 |

88
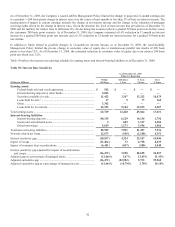
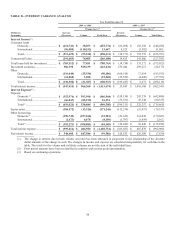
TABLE B—INTEREST VARIANCE ANALYSIS
Year Ended December 31
2009 vs. 2008
2008 vs. 2007
Change due to(1) Change due to(1)
(Dollars in
thousands)
Increase
(Decrease)
Volume Yield/ Rate Increase
(Decrease) Volume
Yield/ Rate
Interest Income(3) :
Consumer loans
Domestic ......................................
.
$ (414,741) $ 38,033 $ (452,774) $ (62,498) $ 183,528 $ (246,026)
International .................................
.
(96,888) (110,535) 13,647 8,323 (3,582) 11,905
Total .............................................
.
$ (511,629) $ (53,018) $ (458,611) $ (54,175) $ 181,592 $ (235,767)
Commercial loans ..................................
.
(191,683) 74,805 (266,488) 14,425 241,806 (227,381)
Total loans held for investment .............
.
$ (703,312) $ 77,451 $ (780,763) $ (39,750) $ 535,272 $ (575,022)
Investment securities .............................
.
386,198 529,239 (143,041) 273,040 299,213 (26,173)
Other
Domestic ......................................
.
(116,040) (25,934) (90,106) (166,918) 17,014 (183,932)
International .................................
.
(14,260) 1,288 (15,548) (32,529) (4,826) (27,703)
Total .............................................
.
$ (130,300) $ (21,387) $ (108,913) $ (199,447) $ 8,671 $ (208,118)
Total interest income .............................
.
$ (447,414) $ 966,260 $ (1,413,674) $ 33,843 $ 1,016,186 $ (982,343)
Interest Expense(3) :
Deposits
Domestic (2) ...................................
.
$ (352,974) $ 593,990 $ (946,964) $ (359,130) $ 283,278 $ (642,408)
International .................................
.
(66,047) (82,198) 16,151 (35,181) 45,344 (80,525)
Total (2) ..........................................
.
$ (419,021) $ 530,484 $ (949,505) $ (394,311) $ 325,357 $ (719,668)
Senior notes ...........................................
.
(184,572) (13,326) (171,246) (132,274) (52,937) (79,337)
Other borrowings
Domestic (2) ...................................
.
(390,749) (357,168) (33,581) (56,645) 114,038 (170,683)
International .................................
.
(1,472) 6,678 (8,150) (1,797) (3,959) 2,162
Total (2) ..........................................
.
$ (392,221) $ (308,081) $ (84,140) $ (58,442) $ 96,840 $ (155,282)
Total interest expense ............................
.
$ (995,814) $ 406,920 $ (1,402,734) $ (585,027) $ 407,879 $ (992,906)
N
et interest income ................................
.
$ 548,400 $ 647,986 $ (99,586) $ 618,870 $ 626,509 $ (7,639)
(1) The change in interest due to both volume and rates has been allocated in proportion to the relationship of the absolute
dollar amounts of the change in each. The changes in income and expense are calculated independently for each line in the
table. The totals for the volume and yield/rate columns are not the sum of the individual lines.
(2) Prior period amounts have been reclassified to conform with current period presentation.
(3) Based on continuing operations.