Capital One 2009 Annual Report Download - page 140
Download and view the complete annual report
Please find page 140 of the 2009 Capital One annual report below. You can navigate through the pages in the report by either clicking on the pages listed below, or by using the keyword search tool below to find specific information within the annual report.-
 1
1 -
2
-
3
-
4
-
5
-
6
-
7
-
8
-
9
-
10
-
11
-
12
-
13
-
14
-
15
-
16
-
17
-
18
-
19
-
20
-
21
-
22
-
23
-
24
-
25
-
26
-
27
-
28
-
29
-
30
-
31
-
32
-
33
-
34
-
35
-
36
-
37
-
38
-
39
-
40
-
41
-
42
-
43
-
44
-
45
-
46
-
47
-
48
-
49
-
50
-
51
-
52
-
53
-
54
-
55
-
56
-
57
-
58
-
59
-
60
-
61
-
62
-
63
-
64
-
65
-
66
-
67
-
68
-
69
-
70
-
71
-
72
-
73
-
74
-
75
-
76
-
77
-
78
-
79
-
80
-
81
-
82
-
83
-
84
-
85
-
86
-
87
-
88
-
89
-
90
-
91
-
92
-
93
-
94
-
95
-
96
-
97
-
98
-
99
-
100
-
101
-
102
-
103
-
104
-
105
-
106
-
107
-
108
-
109
-
110
-
111
-
112
-
113
-
114
-
115
-
116
-
117
-
118
-
119
-
120
-
121
-
122
-
123
-
124
-
125
-
126
-
127
-
128
-
129
-
 130
130 -
 131
131 -
 132
132 -
 133
133 -
 134
134 -
 135
135 -
 136
136 -
 137
137 -
 138
138 -
 139
139 -
 140
140 -
 141
141 -
 142
142 -
 143
143 -
 144
144 -
 145
145 -
 146
146 -
 147
147 -
 148
148 -
 149
149 -
 150
150 -
151
-
152
-
153
-
154
-
155
-
156
-
157
-
158
-
159
-
160
-
161
-
162
-
163
-
164
-
165
-
166
-
167
-
168
-
169
-
170
-
171
-
172
-
173
-
174
-
175
-
176
-
177
-
178
-
179
-
180
-
181
-
182
-
183
-
184
-
185
-
186
-
187
-
188
-
189
-
190
-
191
-
192
-
193
-
194
-
195
-
196
-
197
-
198
-
199
-
200
-
201
-
202
-
203
-
204
-
205
-
206
-
207
-
208
-
209
 |
 |

127
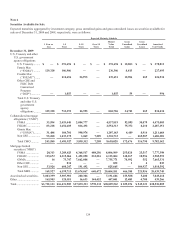
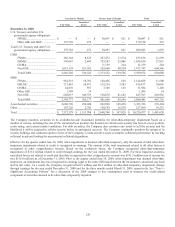
The available-for-sale portfolio continues to be heavily concentrated in high credit quality assets like government-sponsored enterprise
(“GSE”) mortgage-backed securities and AAA rated asset-backed securities. In addition to debt securities held in the investment
portfolio, the Company reports certain equity securities related to Community Reinvestment Act (“CRA”) investments as available for
sale securities within the Other category above.
At December 31, 2009, the portfolio was 90% rated AAA, 5% rated other investment grade (AA to BBB), and 5% non-investment
grade or not rated. At December 31, 2008, the portfolio was 95% rated AAA, 4.8% rated other investment grade (AA to BBB), and
0.2% non-investment grade or not rated.
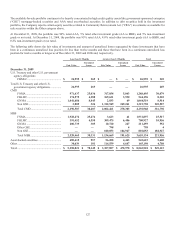
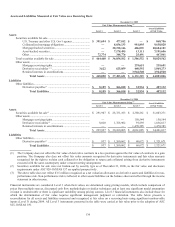
The following table shows the fair value of investments and amount of unrealized losses segregated by those investments that have
been in a continuous unrealized loss position for less than twelve months and those that have been in a continuous unrealized loss
position for twelve months or longer as of December 31, 2009 and 2008 and, respectively.
Less than 12 Months Greater than 12 Months Total
Fair Value Unrealized
Losses Fair Value Unrealized
Losses
Fair Value
Unrealized
Losses
December 31, 2009
U.S. Treasury and other U.S. government
agency obligations
FHMLC ............................................... $ 26,995 $ 269 $ — $ — $ 26,995 $ 269
Total U.S. Treasury and other U.S.
government agency obligations ............... 26,995 269 — — 26,995 269
CMO
FNMA ................................................. 971,437 25,036 317,058 5,043 1,288,495 30,079
FHLMC ............................................... 174,575 4,280 369,621 3,930 544,196 8,210
GNMA ................................................ 1,041,686 8,845 2,833 69 1,044,519 8,914
Non GSE ............................................. 2,809 326 1,312,949 269,261 1,315,758 269,587
Total CMO .......................................... 2,190,507 38,487 2,002,461 278,303 4,192,968 316,790
MBS
FNMA ................................................. 1,928,274 25,476 3,623 41 1,931,897 25,517
FHLMC ............................................... 391,452 4,550 309,475 6,406 700,927 10,956
GNMA ................................................ 200,739 305 10,720 247 211,459 552
Other GSE ........................................... — — 798 4 798 4
Non GSE ............................................. — — 810,053 184,927 810,053 184,927
Total MBS ........................................... 2,520,465 30,331 1,134,669 191,625 3,655,134 221,956
Asset-backed securities ................................. 489,415 957 56,208 4,443 545,623 5,400
Other ............................................................. 30,639 101 114,559 4,607 145,198 4,708
Total .............................................................. $ 5,258,021 $ 70,145 $ 3,307,897 $ 478,978 $ 8,565,918 $ 549,123