Capital One 2009 Annual Report Download - page 137
Download and view the complete annual report
Please find page 137 of the 2009 Capital One annual report below. You can navigate through the pages in the report by either clicking on the pages listed below, or by using the keyword search tool below to find specific information within the annual report.-
 1
1 -
2
-
3
-
4
-
5
-
6
-
7
-
8
-
9
-
10
-
11
-
12
-
13
-
14
-
15
-
16
-
17
-
18
-
19
-
20
-
21
-
22
-
23
-
24
-
25
-
26
-
27
-
28
-
29
-
30
-
31
-
32
-
33
-
34
-
35
-
36
-
37
-
38
-
39
-
40
-
41
-
42
-
43
-
44
-
45
-
46
-
47
-
48
-
49
-
50
-
51
-
52
-
53
-
54
-
55
-
56
-
57
-
58
-
59
-
60
-
61
-
62
-
63
-
64
-
65
-
66
-
67
-
68
-
69
-
70
-
71
-
72
-
73
-
74
-
75
-
76
-
77
-
78
-
79
-
80
-
81
-
82
-
83
-
84
-
85
-
86
-
87
-
88
-
89
-
90
-
91
-
92
-
93
-
94
-
95
-
96
-
97
-
98
-
99
-
100
-
101
-
102
-
103
-
104
-
105
-
106
-
107
-
108
-
109
-
110
-
111
-
112
-
113
-
114
-
115
-
116
-
117
-
118
-
119
-
120
-
121
-
122
-
123
-
124
-
125
-
126
-
 127
127 -
 128
128 -
 129
129 -
 130
130 -
 131
131 -
 132
132 -
 133
133 -
 134
134 -
 135
135 -
 136
136 -
 137
137 -
 138
138 -
 139
139 -
 140
140 -
 141
141 -
 142
142 -
 143
143 -
 144
144 -
 145
145 -
 146
146 -
 147
147 -
148
-
149
-
150
-
151
-
152
-
153
-
154
-
155
-
156
-
157
-
158
-
159
-
160
-
161
-
162
-
163
-
164
-
165
-
166
-
167
-
168
-
169
-
170
-
171
-
172
-
173
-
174
-
175
-
176
-
177
-
178
-
179
-
180
-
181
-
182
-
183
-
184
-
185
-
186
-
187
-
188
-
189
-
190
-
191
-
192
-
193
-
194
-
195
-
196
-
197
-
198
-
199
-
200
-
201
-
202
-
203
-
204
-
205
-
206
-
207
-
208
-
209
 |
 |

124
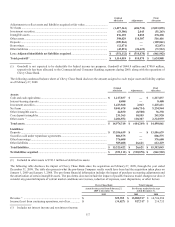
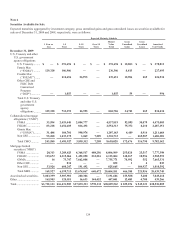
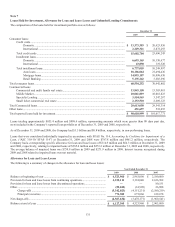
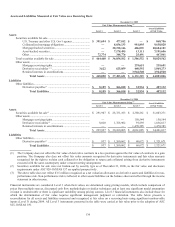
Note 6
Securities Available for Sale
Expected maturities aggregated by investment category, gross unrealized gains and gross unrealized losses on securities available-for
sale as of December 31, 2009 and 2008, respectively, were as follows:
Expected Maturity Schedule
1 Year or
Less
1–5
Years
5–10
Years Over 10
Years
Market
Value
Totals
Gross
Unrealized
Gains
Gross
Unrealized
Losses Amortized
Cost Totals
December 31, 2009
U.S. Treasury and other
U.S. government
agency obligations
U.S. Treasury .......... $ — $ 391,694 $ — $ — $ 391,694 $ 12,883 $ — $ 378,811
Fannie Mae
(“FNMA”) ......... 129,320 106,986 — — 236,306 8,813 — 227,493
Freddie Mac
(“FHLMC”) ....... — 212,656 26,995 — 239,651 12,986 269 226,934
Other GSE and
FDIC Debt
Guaranteed
Program
(“DGP”) ............. — 1,055 — — 1,055 59 — 996
Total U.S. Treasury
and other U.S.
government
agency
obligations ......... 129,320 712,391 26,995 — 868,706 34,741 269 834,234
Collateralized mortgage
obligations (“CMO”)
FNMA .................... 33,594 2,419,448 2,084,777 — 4,537,819 92,895 30,079 4,475,003
FHLMC .................. 83,218 1,654,603 816,492 — 2,554,313 75,372
8,210 2,487,151
Ginnie Mae
(“GNMA”) ......... 31,488 184,701 990,974 — 1,207,163 4,409
8,914 1,211,668
Non GSE ................ 95,280 1,233,175 3,069 7,209 1,338,733 —
269,587 1,608,320
Total CMO ........... 243,580 5,491,927 3,895,312 7,209 9,638,028 172,676 316,790 9,782,142
Mortgage backed
securities (“MBS”)
FNMA .................. 20,313 3,209,823 4,368,517 408,256 8,006,909 255,028 25,517 7,777,398
FHLMC ................ 115,672 2,315,066 1,452,050 232,216 4,115,004 140,367 10,956 3,985,593
GNMA .................. 16 73,747 7,662,008 — 7,735,771 70,992 552 7,665,331
Other GSE ............ — 832 — — 832 1 4 835
Non GSE .............. 33,926 600,247 191,492 — 825,665 — 184,927 1,010,592
Total MBS ............ 169,927 6,199,715 13,674,067 640,472 20,684,181 466,388 221,956 20,439,749
Asset-backed securities .. 3,003,399 3,907,901 280,306 — 7,191,606 153,588 5,400 7,043,418
Other .............................. 165,905 120,051 16,633 144,452 447,041 12,483 4,708 439,266
Total ............................... $ 3,712,131 $16,431,985 $ 17,893,313 $792,133 $38,829,562 $ 839,876 $ 549,123 $38,538,809