Capital One 2009 Annual Report Download - page 109
Download and view the complete annual report
Please find page 109 of the 2009 Capital One annual report below. You can navigate through the pages in the report by either clicking on the pages listed below, or by using the keyword search tool below to find specific information within the annual report.-
 1
1 -
2
-
3
-
4
-
5
-
6
-
7
-
8
-
9
-
10
-
11
-
12
-
13
-
14
-
15
-
16
-
17
-
18
-
19
-
20
-
21
-
22
-
23
-
24
-
25
-
26
-
27
-
28
-
29
-
30
-
31
-
32
-
33
-
34
-
35
-
36
-
37
-
38
-
39
-
40
-
41
-
42
-
43
-
44
-
45
-
46
-
47
-
48
-
49
-
50
-
51
-
52
-
53
-
54
-
55
-
56
-
57
-
58
-
59
-
60
-
61
-
62
-
63
-
64
-
65
-
66
-
67
-
68
-
69
-
70
-
71
-
72
-
73
-
74
-
75
-
76
-
77
-
78
-
79
-
80
-
81
-
82
-
83
-
84
-
85
-
86
-
87
-
88
-
89
-
90
-
91
-
92
-
93
-
94
-
95
-
96
-
97
-
98
-
 99
99 -
 100
100 -
 101
101 -
 102
102 -
 103
103 -
 104
104 -
 105
105 -
 106
106 -
 107
107 -
 108
108 -
 109
109 -
 110
110 -
 111
111 -
 112
112 -
 113
113 -
 114
114 -
 115
115 -
 116
116 -
 117
117 -
 118
118 -
 119
119 -
120
-
121
-
122
-
123
-
124
-
125
-
126
-
127
-
128
-
129
-
130
-
131
-
132
-
133
-
134
-
135
-
136
-
137
-
138
-
139
-
140
-
141
-
142
-
143
-
144
-
145
-
146
-
147
-
148
-
149
-
150
-
151
-
152
-
153
-
154
-
155
-
156
-
157
-
158
-
159
-
160
-
161
-
162
-
163
-
164
-
165
-
166
-
167
-
168
-
169
-
170
-
171
-
172
-
173
-
174
-
175
-
176
-
177
-
178
-
179
-
180
-
181
-
182
-
183
-
184
-
185
-
186
-
187
-
188
-
189
-
190
-
191
-
192
-
193
-
194
-
195
-
196
-
197
-
198
-
199
-
200
-
201
-
202
-
203
-
204
-
205
-
206
-
207
-
208
-
209
 |
 |
96
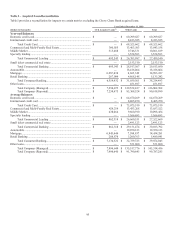
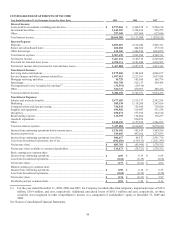
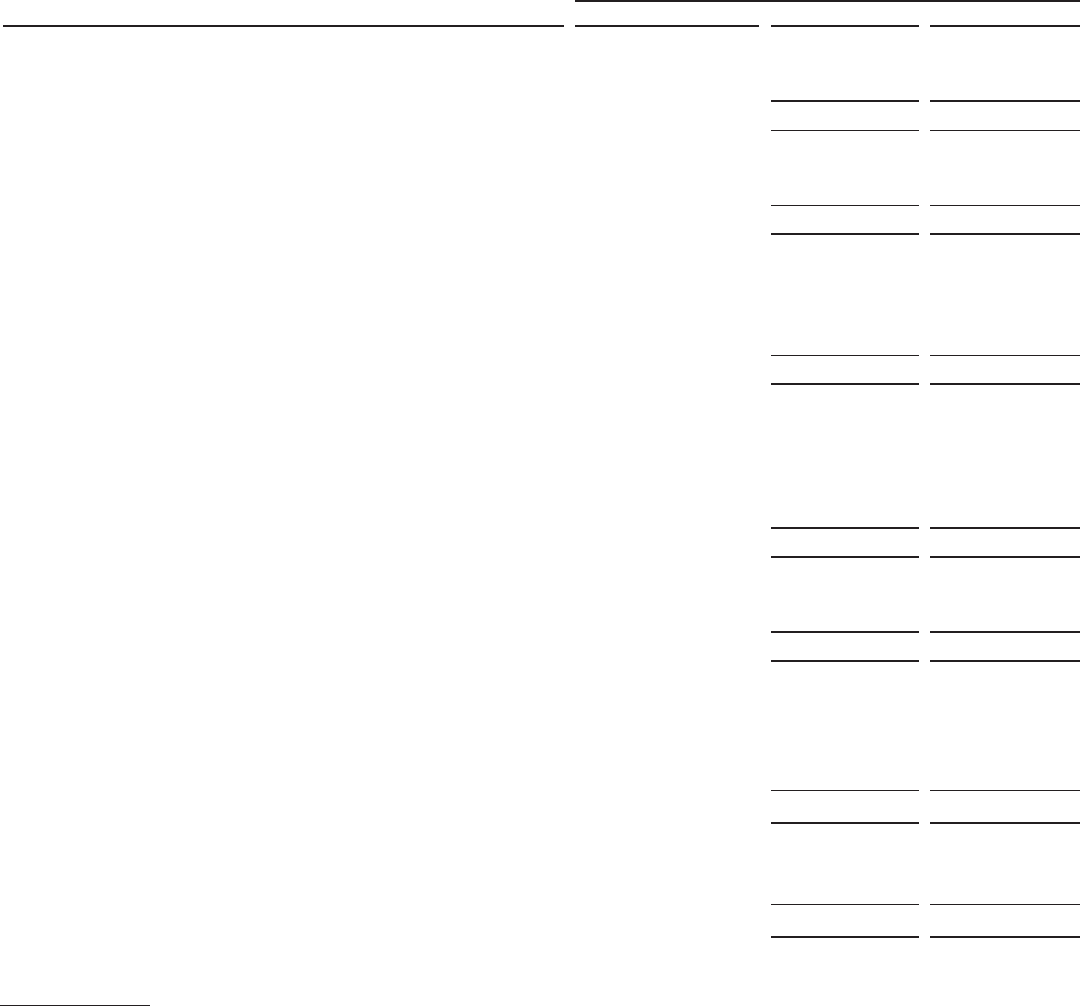
Year Ended December 31, 2009
(Dollars in thousands)
CCB Acquired Loans(1) Other Loans
Total
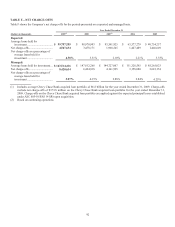
Net charge-off rate:
Commercial and Multi-Family Real Estate ...........................................
.
1.54 % 1.49%
Middle Market ......................................................................................
.
0.52 % 0.49%
Total Commercial Lending ..........................................................
.
1.13 % 1.10%
Total Commercial Banking ................................................
.
1.49 % 1.45%
Mortgage ...............................................................................................
.
1.10 % 0.58%
Retail Banking ......................................................................................
.
2.67 % 2.53%
Total Consumer Banking .............................................................
.
3.34 % 2.74%
Total Company (Managed) ..........................................................
.
6.21 % 5.87%
Total Company (Reported) ..........................................................
.
4.98 % 4.58%
30 + day performing delinquency rate:
Mortgage ...............................................................................................
.
2.18 % 1.26%
Retail Banking ......................................................................................
.
1.30 % 1.23%
Total Consumer Banking .............................................................
.
6.56 % 5.43%
Total Company (Managed) ..........................................................
.
4.99 % 4.73%
Total Company (Reported) ..........................................................
.
4.49 % 4.13%
Non performing loans as a percentage of loans held for
investment:
Commercial and Multi-Family Real Estate ...........................................
.
3.18 % 3.10 %
Middle Market ......................................................................................
.
1.07 % 1.04 %
Total Commercial Lending ..........................................................
.
2.27 % 2.21 %
Total Commercial Banking ................................................
.
2.43 % 2.37 %
Mortgage ...............................................................................................
.
3.75 % 2.17 %
Retail Banking ......................................................................................
.
1.78 % 1.69 %
Total Consumer Banking .............................................................
.
1.75 % 1.45 %
Total Company (Managed) ..........................................................
.
0.99% 0.94 %
Total Company (Reported) ..........................................................
.
1.55% 1.42 %
Non performing assets rate:
Commercial and Multi-Family Real Estate ...........................................
.
3.54% 3.45 %
Middle Market ......................................................................................
.
1.13% 1.09 %
Total Commercial Lending ..........................................................
.
2.50% 2.43 %
Total Commercial Banking ................................................
.
2.72% 2.61 %
Mortgage ...............................................................................................
.
5.27% 3.07 %
Retail Banking ......................................................................................
.
2.23% 2.11 %
Total Consumer Banking .............................................................
.
2.32% 1.92 %
Total Company (Managed) ..........................................................
.
1.19% 1.13 %
Total Company (Reported) ..........................................................
.
1.86% 1.70 %
(1) The loans acquired in the Chevy Chase Bank acquisition are performing as expected when acquired. Accordingly all loans are
considered performing and charge offs have been applied against the credit mark in accordance with ASC 805-10/SFAS 141(R).