Capital One 2009 Annual Report Download - page 56
Download and view the complete annual report
Please find page 56 of the 2009 Capital One annual report below. You can navigate through the pages in the report by either clicking on the pages listed below, or by using the keyword search tool below to find specific information within the annual report.-
 1
1 -
2
-
3
-
4
-
5
-
6
-
7
-
8
-
9
-
10
-
11
-
12
-
13
-
14
-
15
-
16
-
17
-
18
-
19
-
20
-
21
-
22
-
23
-
24
-
25
-
26
-
27
-
28
-
29
-
30
-
31
-
32
-
33
-
34
-
35
-
36
-
37
-
38
-
39
-
40
-
41
-
42
-
43
-
44
-
45
-
 46
46 -
 47
47 -
 48
48 -
 49
49 -
 50
50 -
 51
51 -
 52
52 -
 53
53 -
 54
54 -
 55
55 -
 56
56 -
 57
57 -
 58
58 -
 59
59 -
 60
60 -
 61
61 -
 62
62 -
 63
63 -
 64
64 -
 65
65 -
 66
66 -
67
-
68
-
69
-
70
-
71
-
72
-
73
-
74
-
75
-
76
-
77
-
78
-
79
-
80
-
81
-
82
-
83
-
84
-
85
-
86
-
87
-
88
-
89
-
90
-
91
-
92
-
93
-
94
-
95
-
96
-
97
-
98
-
99
-
100
-
101
-
102
-
103
-
104
-
105
-
106
-
107
-
108
-
109
-
110
-
111
-
112
-
113
-
114
-
115
-
116
-
117
-
118
-
119
-
120
-
121
-
122
-
123
-
124
-
125
-
126
-
127
-
128
-
129
-
130
-
131
-
132
-
133
-
134
-
135
-
136
-
137
-
138
-
139
-
140
-
141
-
142
-
143
-
144
-
145
-
146
-
147
-
148
-
149
-
150
-
151
-
152
-
153
-
154
-
155
-
156
-
157
-
158
-
159
-
160
-
161
-
162
-
163
-
164
-
165
-
166
-
167
-
168
-
169
-
170
-
171
-
172
-
173
-
174
-
175
-
176
-
177
-
178
-
179
-
180
-
181
-
182
-
183
-
184
-
185
-
186
-
187
-
188
-
189
-
190
-
191
-
192
-
193
-
194
-
195
-
196
-
197
-
198
-
199
-
200
-
201
-
202
-
203
-
204
-
205
-
206
-
207
-
208
-
209
 |
 |

43
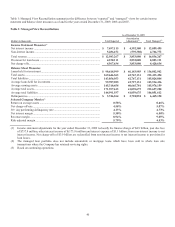
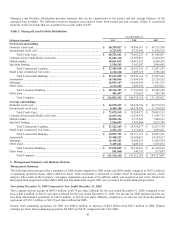
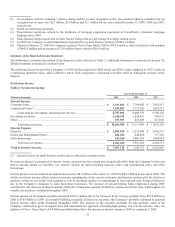
Managed Loan Portfolio Distribution provides summary data on the composition of the period end and average balances of the
managed loan portfolio. The difference between managed and reported loans, both period end and average, relates to securitized
domestic credit card loans that are accounted for as sales under GAAP.
Table 2: Managed Loan Portfolio Distribution
As of December 31,
(Dollars in thousands) 2009 2008
2007
Period end outstanding
Domestic credit card ............................................................................................. $ 60,299,827 $ 70,944,581 $ 69,723,169
International credit card ........................................................................................ 8,223,835 8,720,642 11,656,922
Total Credit Card ......................................................................................... $ 68,523,662 $ 79,665,223 $ 81,380,091
Commercial and multi-family real estate .............................................................. 13,843,158 13,303,081 12,414,263
Middle market ....................................................................................................... 10,061,819 10,081,823 8,288,476
Specialty lending ................................................................................................... 3,554,563 3,547,287 2,948,402
Total Commercial Lending .......................................................................... $ 27,459,540 $ 26,932,191 $ 23,651,141
Small ticket commercial real estate ....................................................................... 2,153,510 2,609,123 3,396,100
Total Commercial Banking ......................................................................... $ 29,613,050 $ 29,541,314 $ 27,047,241
Automobile ........................................................................................................... 18,186,064 21,494,436 25,128,352
Mortgage ............................................................................................................... 14,893,187 10,098,430 11,561,533
Other retail ............................................................................................................ 5,135,242 5,603,696 5,659,411
Total Consumer Banking ............................................................................. $ 38,214,493 $ 37,196,562 $ 42,349,296
Other loans ............................................................................................................ 451,697 533,655 585,789
Total Company ............................................................................................ $ 136,802,902 $ 146,936,754 $ 151,362,417
Average outstandings
Domestic credit card ............................................................................................. $ 64,670,269 $ 68,634,756 $ 66,774,914
International credit card ........................................................................................ 8,405,250 10,570,791 11,310,239
Total Credit Card ......................................................................................... $ 73,075,519 $ 79,208,971 $ 78,085,153
Commercial and multi-family real estate .............................................................. 13,857,522 12,829,870 11,905,715
Middle market ....................................................................................................... 10,098,454 9,172,541 7,404,313
Specialty lending ................................................................................................... 3,566,693 3,595,866 2,923,702
Total Commercial Lending .......................................................................... $ 27,522,669 $ 25,598,277 $ 22,233,730
Small ticket commercial real estate ....................................................................... 2,491,123 3,115,436 2,669,621
Total Commercial Banking ......................................................................... $ 30,013,792 $ 28,713,713 $ 24,903,351
Automobile ........................................................................................................... 19,950,123 23,490,015 24,150,217
Mortgage ............................................................................................................... 14,434,281 10,406,251 11,805,524
Other retail ............................................................................................................ 5,489,641 5,449,185 5,565,075
Total Consumer Banking ............................................................................. $ 39,874,045 $ 39,345,451 $ 41,520,816
Other loans ............................................................................................................ 551,060 544,131 217,687
Total Company ............................................................................................ $ 143,514,416 $ 147,812,266 $ 144,727,007
V. Management Summary and Business Outlook
Management Summary
The following discussion provides a summary of 2009 results compared to 2008 results and 2008 results compared to 2007 results on
a continuing operations basis, unless otherwise noted. Each component is discussed in further detail in subsequent sections of this
analysis. The results of the Company’s mortgage origination operations of GreenPoint, which was acquired as part of the North Fork
Bancorporation acquisition in December 2006 and discontinued in August 2007, are accounted for as discontinued operations.
Year Ended December 31, 2009 Compared to Year Ended December 31, 2008
The Company had net income of $883.8 million, or $0.74 per share (diluted) for the year ended December 31, 2009, compared to net
loss of $46.0 million, or $(0.21) per share (diluted) for the year ended December 31, 2008. Net income for 2009 included an after-tax
loss from discontinued operations of $102.8 million, or $(0.24) per share (diluted), compared to an after-tax loss from discontinued
operations of $130.5 million, or $(0.35) per share (diluted) in 2008.
Income from continuing operations for 2009 was $986.6 million, an increase of $0.9 billion from $84.5 million in 2008. Diluted
earnings per share from continuing operations for 2009 was $0.98, compared to $0.14 in 2008.