Capital One 2009 Annual Report Download - page 87
Download and view the complete annual report
Please find page 87 of the 2009 Capital One annual report below. You can navigate through the pages in the report by either clicking on the pages listed below, or by using the keyword search tool below to find specific information within the annual report.-
 1
1 -
2
-
3
-
4
-
5
-
6
-
7
-
8
-
9
-
10
-
11
-
12
-
13
-
14
-
15
-
16
-
17
-
18
-
19
-
20
-
21
-
22
-
23
-
24
-
25
-
26
-
27
-
28
-
29
-
30
-
31
-
32
-
33
-
34
-
35
-
36
-
37
-
38
-
39
-
40
-
41
-
42
-
43
-
44
-
45
-
46
-
47
-
48
-
49
-
50
-
51
-
52
-
53
-
54
-
55
-
56
-
57
-
58
-
59
-
60
-
61
-
62
-
63
-
64
-
65
-
66
-
67
-
68
-
69
-
70
-
71
-
72
-
73
-
74
-
75
-
76
-
 77
77 -
 78
78 -
 79
79 -
 80
80 -
 81
81 -
 82
82 -
 83
83 -
 84
84 -
 85
85 -
 86
86 -
 87
87 -
 88
88 -
 89
89 -
 90
90 -
 91
91 -
 92
92 -
 93
93 -
 94
94 -
 95
95 -
 96
96 -
 97
97 -
98
-
99
-
100
-
101
-
102
-
103
-
104
-
105
-
106
-
107
-
108
-
109
-
110
-
111
-
112
-
113
-
114
-
115
-
116
-
117
-
118
-
119
-
120
-
121
-
122
-
123
-
124
-
125
-
126
-
127
-
128
-
129
-
130
-
131
-
132
-
133
-
134
-
135
-
136
-
137
-
138
-
139
-
140
-
141
-
142
-
143
-
144
-
145
-
146
-
147
-
148
-
149
-
150
-
151
-
152
-
153
-
154
-
155
-
156
-
157
-
158
-
159
-
160
-
161
-
162
-
163
-
164
-
165
-
166
-
167
-
168
-
169
-
170
-
171
-
172
-
173
-
174
-
175
-
176
-
177
-
178
-
179
-
180
-
181
-
182
-
183
-
184
-
185
-
186
-
187
-
188
-
189
-
190
-
191
-
192
-
193
-
194
-
195
-
196
-
197
-
198
-
199
-
200
-
201
-
202
-
203
-
204
-
205
-
206
-
207
-
208
-
209
 |
 |

74
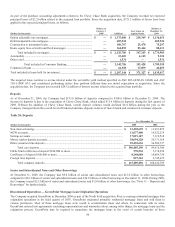
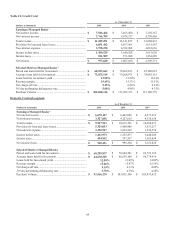
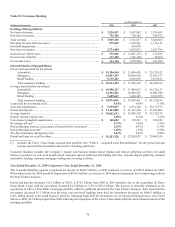
Table 23: Consumer Banking
As of December 31,
(Dollars in thousands) 2009 2008
2007
Earnings (Managed Basis)
N
et interest income ............................................................................................ $ 3,230,597 $ 2,987,962 $ 2,915,693
N
on-interest income ........................................................................................... 755,188 728,705 924,872
Total revenue ..................................................................................................... $ 3,985,785 $ 3,716,667 $ 3,840,565
Provision for loan and lease losses .................................................................... 875,649 1,534,281 1,116,143
Goodwill Impairment ......................................................................................... — 810,876 —
N
on-interest expense .......................................................................................... 2,734,450 2,452,637 2,567,794
Income (loss) before taxes ................................................................................. $ 375,686 $ (1,081,127) $ 156,628
Income taxes (benefit) ........................................................................................ 131,490 (101,146) 54,699
N
et income (loss) ............................................................................................... $ 244,196 $ (979,981) $ 101,929
Selected Metrics (Managed Basis)
Period end loans held for investment
Automobile ............................................................................................... $ 18,186,064 $ 21,494,436 $ 25,128,352
Mortgages ................................................................................................. 14,893,187 10,098,430 11,561,533
Retail banking .......................................................................................... 5,135,242 5,603,696 5,659,411
Total consumer banking ........................................................................... $ 38,214,493 $ 37,196,562 $ 42,349,296
Average loans held for investment
Automobile ............................................................................................... $ 19,950,123 $ 23,490,015 $ 24,150,217
Mortgages ................................................................................................. 14,434,281 10,406,251 11,085,524
Retail banking .......................................................................................... 5,489,641 5,449,185 5,565,075
Total consumer banking ........................................................................... $ 39,874,045 $ 39,345,451 $ 41,520,816
Loans held for investment yield ......................................................................... 8.94% 9.69% 9.19%
Auto loan originations ........................................................................................ $ 5,335,817 $ 6,874,340 $ 13,176,533
Period end deposits ............................................................................................ $ 74,144,805 $ 61,763,503 $ 57,692,006
Average deposits ................................................................................................ $ 70,862,633 $ 56,998,395 $ 55,718,239
Deposit interest expense rate.............................................................................. 1.68% 2.52% 3.27%
Core deposit intangible amortization ................................................................. $ 168,682 $ 152,593 $ 168,949
N
et charge-off rate(1) .......................................................................................... 2.74% 3.09% 1.96%
N
on-performing loans as a percentage of loans held for investment(1) .............. 1.45% 0.93% 0.74%
N
on-performing asset rate(1) .............................................................................. 1.60% 1.19% 0.90%
30+ day performing delinquency rate(1) ............................................................. 5.43% 6.31% 4.92%
Period end loans serviced for others .................................................................. $ 30,283,326 $ 22,926,037 $ 29,408,359
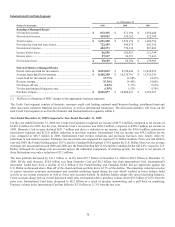
(1) Includes the Chevy Chase Bank acquired loan portfolio. See “Table I – Acquired Loan Reconciliation” for the period end and
average loans held for investment and metrics excluding such loans.
Consumer Banking includes the Company’s branch and business banker based lending and deposit gathering activities for small
business customers as well as its branch based consumer deposit gathering and lending activities, national deposit gathering, national
automobile lending, consumer mortgage lending and servicing activities.
Year Ended December 31, 2009 Compared to Year Ended December 31, 2008
The Consumer Banking segment recognized net income of $244.2 million, in 2009 compared to net loss of $980.0 million for 2008.
When adjusted for the 2008 goodwill impairment of $810.9 million, net income in 2009 increased primarily due to improving credit in
the Auto Finance business.
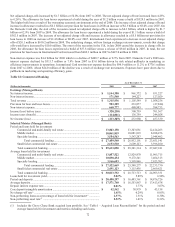
Period end deposits increased $12.4 billion or 20.0% to $74.1 billion from 2008 to 2009 primarily due to the acquisition of Chevy
Chase Bank. Loans held for investment increased $1.0 billion or 2.7% to $38.2 billion. The increase is primarily attributed to the
acquisition of Chevy Chase Bank’s mortgage portfolio offset by pullbacks initiated in the Auto Finance business. Auto loans held for
investment decreased $3.3 billion over the prior year and retail banking loans held for investment decreased by $468.5 million or
8.4%, falling mostly in the small business portfolio. Mortgage loans held for investment, net of expected principal losses, were $14.9
billion in 2009, $4.8 billion higher than 2008 reflecting the acquisition of the Chevy Chase Bank portfolio and continued run-off of the
mortgage portfolio.