Capital One 2009 Annual Report Download - page 106
Download and view the complete annual report
Please find page 106 of the 2009 Capital One annual report below. You can navigate through the pages in the report by either clicking on the pages listed below, or by using the keyword search tool below to find specific information within the annual report.-
 1
1 -
2
-
3
-
4
-
5
-
6
-
7
-
8
-
9
-
10
-
11
-
12
-
13
-
14
-
15
-
16
-
17
-
18
-
19
-
20
-
21
-
22
-
23
-
24
-
25
-
26
-
27
-
28
-
29
-
30
-
31
-
32
-
33
-
34
-
35
-
36
-
37
-
38
-
39
-
40
-
41
-
42
-
43
-
44
-
45
-
46
-
47
-
48
-
49
-
50
-
51
-
52
-
53
-
54
-
55
-
56
-
57
-
58
-
59
-
60
-
61
-
62
-
63
-
64
-
65
-
66
-
67
-
68
-
69
-
70
-
71
-
72
-
73
-
74
-
75
-
76
-
77
-
78
-
79
-
80
-
81
-
82
-
83
-
84
-
85
-
86
-
87
-
88
-
89
-
90
-
91
-
92
-
93
-
94
-
95
-
 96
96 -
 97
97 -
 98
98 -
 99
99 -
 100
100 -
 101
101 -
 102
102 -
 103
103 -
 104
104 -
 105
105 -
 106
106 -
 107
107 -
 108
108 -
 109
109 -
 110
110 -
 111
111 -
 112
112 -
 113
113 -
 114
114 -
 115
115 -
 116
116 -
117
-
118
-
119
-
120
-
121
-
122
-
123
-
124
-
125
-
126
-
127
-
128
-
129
-
130
-
131
-
132
-
133
-
134
-
135
-
136
-
137
-
138
-
139
-
140
-
141
-
142
-
143
-
144
-
145
-
146
-
147
-
148
-
149
-
150
-
151
-
152
-
153
-
154
-
155
-
156
-
157
-
158
-
159
-
160
-
161
-
162
-
163
-
164
-
165
-
166
-
167
-
168
-
169
-
170
-
171
-
172
-
173
-
174
-
175
-
176
-
177
-
178
-
179
-
180
-
181
-
182
-
183
-
184
-
185
-
186
-
187
-
188
-
189
-
190
-
191
-
192
-
193
-
194
-
195
-
196
-
197
-
198
-
199
-
200
-
201
-
202
-
203
-
204
-
205
-
206
-
207
-
208
-
209
 |
 |

93
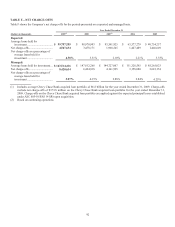
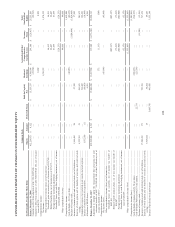
TABLE G—NONPERFORMING ASSETS (Reported)
Table G shows a summary of nonperforming assets for the periods indicated.
As of December 31
(Dollars in thousands)
2009 2008 2007
2006 2005
N
onperforming loans held for investmen
t
(1) (2):
Commercial lending .........................................................
Commercial and multi-family real estate ................ $ 428,754 $ 142,261 $ 29,391 $ 13,745 $ 7,800
Middle market ......................................................... 104,272 38,677 28,772 10,820 50,957
Small ticket commercial real estate ........................ 94,674 167,467 16,026 237 —
Specialty lending..................................................... 73,866 37,217 6,086 226 —
Total commercial loans ................................. 701,566 385,622 80,275 25,028 58,757
Consumer lending ............................................................
Automobile ............................................................. 143,341 164,646 156,580 86,943 61,053
Mortgages ............................................................... 322,473 104,498 97,969 54,325 46,632
Other consumer loans ............................................. 121,326 149,586 58,489 264 217
Total consumer loans .................................... 587,140 418,730 313,038 141,532 107,902
Total nonperforming loans held for investment ............... 1,288,706 804,352 393,313 166,560 166,659
Foreclosed property(4) ....................................................... 233,749 88,961 48,016 16,146 8,436
Repossessed assets ........................................................... 24,503 65,635 56,877 30,844 22,917
Total nonperforming assets .............................................
.
$ 1,546,958 $ 958,948 $ 498,206 $ 213,550 $ 198,012
N
onperforming loans as a percentage of loans held fo
r
investment(3) ...............................................................
.
1.42 % 0.80 % 0.39 % 0.17% 0.28 %
N
onperforming assets as a percentage of loans held fo
r
investment(3) ...............................................................
.
1.70 % 0.95 % 0.49 % 0.22% 0.33 %
(1) Our policy is not to classify credit card loans as nonperforming loans. See Table E-Delinquencies for accruing loans
contractually past due 90 days more.
(2) Excludes loans acquired from the Chevy Chase Bank acquisition and previously considered nonperforming of $1,205.6 million
as these loans have been recorded at fair value and are considered performing in accordance with ASC 805-10/SFAS 141(R)
and/or ASC 310-10/SOP 03-3.
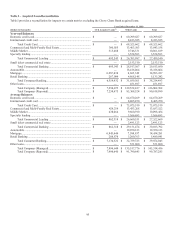
(3) Includes the loans acquired from the Chevy Chase Bank acquisition in the denominator. See “Table I – Acquired Loan
Reconciliation” for the rates excluding the acquired loan portfolio.
(4) The acquisition of Chevy Chase Bank added $154.3 million to foreclosed property.