Capital One 2009 Annual Report Download - page 144
Download and view the complete annual report
Please find page 144 of the 2009 Capital One annual report below. You can navigate through the pages in the report by either clicking on the pages listed below, or by using the keyword search tool below to find specific information within the annual report.-
 1
1 -
2
-
3
-
4
-
5
-
6
-
7
-
8
-
9
-
10
-
11
-
12
-
13
-
14
-
15
-
16
-
17
-
18
-
19
-
20
-
21
-
22
-
23
-
24
-
25
-
26
-
27
-
28
-
29
-
30
-
31
-
32
-
33
-
34
-
35
-
36
-
37
-
38
-
39
-
40
-
41
-
42
-
43
-
44
-
45
-
46
-
47
-
48
-
49
-
50
-
51
-
52
-
53
-
54
-
55
-
56
-
57
-
58
-
59
-
60
-
61
-
62
-
63
-
64
-
65
-
66
-
67
-
68
-
69
-
70
-
71
-
72
-
73
-
74
-
75
-
76
-
77
-
78
-
79
-
80
-
81
-
82
-
83
-
84
-
85
-
86
-
87
-
88
-
89
-
90
-
91
-
92
-
93
-
94
-
95
-
96
-
97
-
98
-
99
-
100
-
101
-
102
-
103
-
104
-
105
-
106
-
107
-
108
-
109
-
110
-
111
-
112
-
113
-
114
-
115
-
116
-
117
-
118
-
119
-
120
-
121
-
122
-
123
-
124
-
125
-
126
-
127
-
128
-
129
-
130
-
131
-
132
-
133
-
 134
134 -
 135
135 -
 136
136 -
 137
137 -
 138
138 -
 139
139 -
 140
140 -
 141
141 -
 142
142 -
 143
143 -
 144
144 -
 145
145 -
 146
146 -
 147
147 -
 148
148 -
 149
149 -
 150
150 -
 151
151 -
 152
152 -
 153
153 -
 154
154 -
155
-
156
-
157
-
158
-
159
-
160
-
161
-
162
-
163
-
164
-
165
-
166
-
167
-
168
-
169
-
170
-
171
-
172
-
173
-
174
-
175
-
176
-
177
-
178
-
179
-
180
-
181
-
182
-
183
-
184
-
185
-
186
-
187
-
188
-
189
-
190
-
191
-
192
-
193
-
194
-
195
-
196
-
197
-
198
-
199
-
200
-
201
-
202
-
203
-
204
-
205
-
206
-
207
-
208
-
209
 |
 |

131
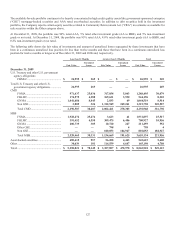
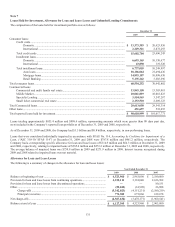
Note 7
Loans Held for Investment, Allowance for Loan and Lease Losses and Unfunded Lending Commitments
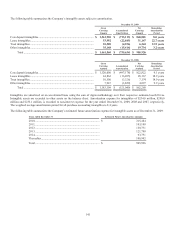
The composition of the loans held for investment portfolio was as follows:
December 31
2009
2008
Consumer loans:
Credit cards ...................................................................................................................................
Domestic ............................................................................................................................. $ 13,373,383 $ 20,623,950
International ........................................................................................................................ 2,229,321 2,872,293
Total credit cards .......................................................................................................................... 15,602,704 23,496,243
Installment loans ...........................................................................................................................
Domestic ............................................................................................................................. 6,693,165 10,130,677
International ........................................................................................................................ 43,890 119,320
Total installment loans .................................................................................................................. 6,737,055 10,249,997
Auto loans ........................................................................................................................... 18,186,064 21,494,436
Mortgage loans .................................................................................................................... 14,893,187 10,098,430
Retail Banking..................................................................................................................... 5,135,242 5,603,696
Total consumer loans ............................................................................................................................. 60,554,252 70,942,802
Commercial loans
Commercial and multi family real estate ...................................................................................... 13,843,158 13,303,081
Middle Market .............................................................................................................................. 10,061,819 10,081,823
Specialty Lending ......................................................................................................................... 3,554,563 3,547,287
Small ticket commercial real estate .............................................................................................. 2,153,510 2,609,123
Total Commercial loans ......................................................................................................................... 29,613,050 29,541,314
Other loans ............................................................................................................................................. 451,697 533,655
Total reported loans held for investment ................................................................................................ $ 90,618,999 $ 101,017,771
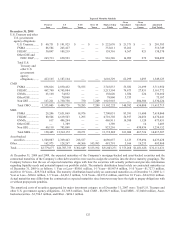
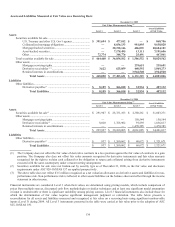
Loans totaling approximately $853.4 million and $998.6 million, representing amounts which were greater than 90 days past due,
were included in the Company’s reported loan portfolio as of December 31, 2009 and 2008, respectively.
As of December 31, 2009 and 2008, the Company had $1.3 billion and $0.8 billion, respectively, in non-performing loans.
Loans that were considered individually impaired in accordance with SFAS No. 114, Accounting by Creditors for Impairment of a
Loan, (“ASC 310-10/ SFAS 114”) at December 31, 2009 and 2008 were $787.8 million and $461.2 million, respectively. The
Company had a corresponding specific allowance for loan and lease losses of $114.9 million and $64.3 million at December 31, 2009
and 2008, respectively, relating to impaired loans of $385.6 million and $272.2 million at December 31, 2009 and 2008, respectively.
The average balance of impaired loans was $759.8 million in 2009 and $271.9 million in 2008. Interest income recognized during
2009 and 2008 related to impaired loans was not material.
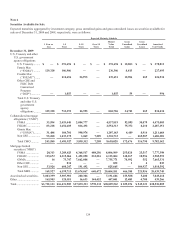
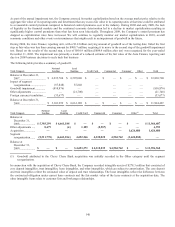
Allowance for Loan and Lease Losses
The following is a summary of changes in the allowance for loan and lease losses:
Year Ended December 31
2009 2008
2007
Balance at beginning of year .....................................................................................
.
$ 4,523,960 $ 2,963,000 $ 2,180,000
Provision for loan and lease losses from continuing operations ................................
.
4,230,111 5,101,040 2,636,502
Provision for loan and lease losses from discontinued operations .............................
.
— — 80,151
Other ..........................................................................................................................
.
(59,042) (61,909) 26,888
Charge-offs ......................................................................................................
.
(5,342,023) (4,151,231) (2,580,219)
Principal recoveries ..........................................................................................
.
774,389 673,060 619,678
N
et charge-offs ..........................................................................................................
.
(4,567,634) (3,478,171) (1,960,541)
Balance at end of year ...............................................................................................
.
$ 4,127,395 $ 4,523,960 $ 2,963,000