Capital One 2009 Annual Report Download - page 83
Download and view the complete annual report
Please find page 83 of the 2009 Capital One annual report below. You can navigate through the pages in the report by either clicking on the pages listed below, or by using the keyword search tool below to find specific information within the annual report.-
 1
1 -
2
-
3
-
4
-
5
-
6
-
7
-
8
-
9
-
10
-
11
-
12
-
13
-
14
-
15
-
16
-
17
-
18
-
19
-
20
-
21
-
22
-
23
-
24
-
25
-
26
-
27
-
28
-
29
-
30
-
31
-
32
-
33
-
34
-
35
-
36
-
37
-
38
-
39
-
40
-
41
-
42
-
43
-
44
-
45
-
46
-
47
-
48
-
49
-
50
-
51
-
52
-
53
-
54
-
55
-
56
-
57
-
58
-
59
-
60
-
61
-
62
-
63
-
64
-
65
-
66
-
67
-
68
-
69
-
70
-
71
-
72
-
 73
73 -
 74
74 -
 75
75 -
 76
76 -
 77
77 -
 78
78 -
 79
79 -
 80
80 -
 81
81 -
 82
82 -
 83
83 -
 84
84 -
 85
85 -
 86
86 -
 87
87 -
 88
88 -
 89
89 -
 90
90 -
 91
91 -
 92
92 -
 93
93 -
94
-
95
-
96
-
97
-
98
-
99
-
100
-
101
-
102
-
103
-
104
-
105
-
106
-
107
-
108
-
109
-
110
-
111
-
112
-
113
-
114
-
115
-
116
-
117
-
118
-
119
-
120
-
121
-
122
-
123
-
124
-
125
-
126
-
127
-
128
-
129
-
130
-
131
-
132
-
133
-
134
-
135
-
136
-
137
-
138
-
139
-
140
-
141
-
142
-
143
-
144
-
145
-
146
-
147
-
148
-
149
-
150
-
151
-
152
-
153
-
154
-
155
-
156
-
157
-
158
-
159
-
160
-
161
-
162
-
163
-
164
-
165
-
166
-
167
-
168
-
169
-
170
-
171
-
172
-
173
-
174
-
175
-
176
-
177
-
178
-
179
-
180
-
181
-
182
-
183
-
184
-
185
-
186
-
187
-
188
-
189
-
190
-
191
-
192
-
193
-
194
-
195
-
196
-
197
-
198
-
199
-
200
-
201
-
202
-
203
-
204
-
205
-
206
-
207
-
208
-
209
 |
 |

70
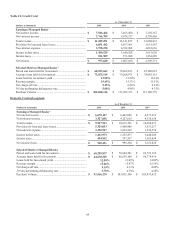
International Card Sub-Segment
As of December 31
(Dollars in thousands)
2009 2008
2007
Earnings (Managed Basis) (1)
N
et interest income .......................................................................
.
$ 872,335 $ 971,394 $ 1,058,448
N
on-interest income .....................................................................
.
418,953 550,762 622,308
Total revenue ................................................................................
.
$ 1,291,288 $ 1,522,156 $ 1,680,756
Provision for loan and lease losses ...............................................
.
722,459 646,975 602,350
N
on-interest expense ....................................................................
.
482,273 770,130 867,062
Income before taxes .....................................................................
.
86,556 105,051 211,344
Income taxes .................................................................................
.
27,367 36,351 71,441
N
et income (loss) .........................................................................
.
$ 59,189 $ 68,700 $ 139,903
Selected Metrics (Managed Basis)
Period end loans held for investment ...........................................
.
$ 8,223,835 $ 8,720,642 $ 11,656,922
Average loans held for investment ...............................................
.
$ 8,405,250 $ 10,570,791 $ 11,310,239
Loans held for investment yield ...................................................
.
13.71% 13.88% 14.41%
Revenue margin ............................................................................
.
15.36% 14.40% 14.86%
N
et charge-off rate .......................................................................
.
8.83% 5.77% 5.63%
30+day performing delinquency rate ............................................
.
6.55% 5.51% 4.79%
Purchase Volume ..........................................................................
.
$ 8,501,877 $ 10,800,227 $ 9,305,307
(1) Reflects re-allocation of FDIC charges to the appropriate business segments.
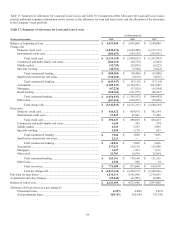
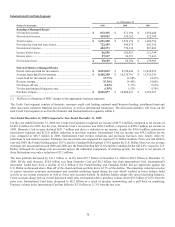
The Credit Card segment consists of domestic consumer credit card lending, national small business lending, installment loans and
other unsecured consumer financial service activities as well as international businesses. The discussion narrative will focus on the
total Credit Card segment as well as the Domestic and International sub-segments within it.
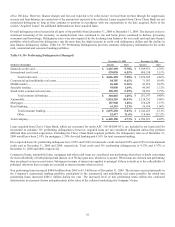
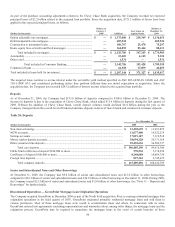
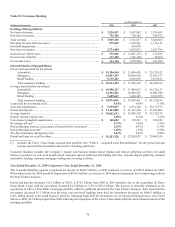
Year Ended December 31, 2009 Compared to Year Ended December 31, 2008
For the year ended December 31, 2009, the Credit Card segment recognized net income of $977.6 million, compared to net income of
$1,067.0 million for 2008. For the year, Domestic Card’s net income was $918.4 million, compared to $998.3 million net income in
2008. Domestic Card revenue declined $621.7 million and drove a reduction in net income, despite the $366.9 million reduction in
non-interest expenses and $132.0 million reduction in provision expense. International Card net income was $59.2 million for the
year, compared to $68.7 million in 2008. International Card revenue reductions and provision increases were largely offset by
reductions in non-interest expense. Exchange rate movements also impacted the reported U.S. Dollar numbers. From year end 2008 to
year end 2009, the Pound Sterling gained 10.5% and the Canadian Dollar gained 15.8% against the U.S. Dollar. However, the average
exchange rate movement between 2008 and 2009 saw the Pound Sterling fall 15.6% and the Canadian Dollar fall 6.6% versus the U.S.
Dollar. Although the exchange rate movements impact the individual components of earnings greatly, the impact to net income of
these fluctuations was only a reduction of $3.1 million.
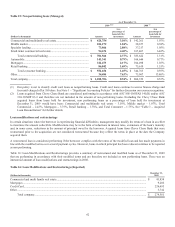
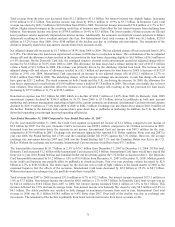
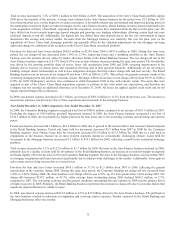
The loan portfolio decreased by $11.1 billion or 14.0% from $79.7 billion at December 31, 2008 to $68.5 billion at December 31,
2009. Of the total decrease, $10.6 billion was from Domestic Card and $0.5 billion was from International Card. International’s
movement would have been a decline of $1.6 billion if the Pound Sterling and Canadian Dollar did not appreciate against the
U.S. Dollar as discussed above. Run-off of the closed end loan portfolio drove 42.7% of the decline. The remaining reduction was due
to current uncertain economic environment and curtailed marketing spend during the year which resulted in lower balance build
activity to our current customers as well as fewer new accounts booked. In addition, higher charge-offs caused declining balances.
Fewer accounts along with an overall depressed retail sales environment drove purchase volume down $9.5 billion or 9.2% from the
prior year. International Card loans decreased to $8.2 billion as a result of prudent underwriting and a pull back on marketing.
Purchase volume in the International Card has fallen by $2.3 billion or 21.3% from the last year.