Capital One 2009 Annual Report Download - page 197
Download and view the complete annual report
Please find page 197 of the 2009 Capital One annual report below. You can navigate through the pages in the report by either clicking on the pages listed below, or by using the keyword search tool below to find specific information within the annual report.-
 1
1 -
2
-
3
-
4
-
5
-
6
-
7
-
8
-
9
-
10
-
11
-
12
-
13
-
14
-
15
-
16
-
17
-
18
-
19
-
20
-
21
-
22
-
23
-
24
-
25
-
26
-
27
-
28
-
29
-
30
-
31
-
32
-
33
-
34
-
35
-
36
-
37
-
38
-
39
-
40
-
41
-
42
-
43
-
44
-
45
-
46
-
47
-
48
-
49
-
50
-
51
-
52
-
53
-
54
-
55
-
56
-
57
-
58
-
59
-
60
-
61
-
62
-
63
-
64
-
65
-
66
-
67
-
68
-
69
-
70
-
71
-
72
-
73
-
74
-
75
-
76
-
77
-
78
-
79
-
80
-
81
-
82
-
83
-
84
-
85
-
86
-
87
-
88
-
89
-
90
-
91
-
92
-
93
-
94
-
95
-
96
-
97
-
98
-
99
-
100
-
101
-
102
-
103
-
104
-
105
-
106
-
107
-
108
-
109
-
110
-
111
-
112
-
113
-
114
-
115
-
116
-
117
-
118
-
119
-
120
-
121
-
122
-
123
-
124
-
125
-
126
-
127
-
128
-
129
-
130
-
131
-
132
-
133
-
134
-
135
-
136
-
137
-
138
-
139
-
140
-
141
-
142
-
143
-
144
-
145
-
146
-
147
-
148
-
149
-
150
-
151
-
152
-
153
-
154
-
155
-
156
-
157
-
158
-
159
-
160
-
161
-
162
-
163
-
164
-
165
-
166
-
167
-
168
-
169
-
170
-
171
-
172
-
173
-
174
-
175
-
176
-
177
-
178
-
179
-
180
-
181
-
182
-
183
-
184
-
185
-
186
-
 187
187 -
 188
188 -
 189
189 -
 190
190 -
 191
191 -
 192
192 -
 193
193 -
 194
194 -
 195
195 -
 196
196 -
 197
197 -
 198
198 -
 199
199 -
 200
200 -
 201
201 -
 202
202 -
 203
203 -
 204
204 -
 205
205 -
 206
206 -
 207
207 -
208
-
209
 |
 |

184
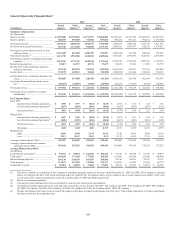
Selected Quarterly Financial Data(1)
2009 2008
(Unaudited)
Fourth
Quarter
Third
Quarter (5) Second
Quarter (5) First
Quarter (5) Fourth
Quarter Third
Quarter
Second
Quarter First
Quarter
Summary of Operations:
(In Thousands)
Interest income .................................................
.
$ 2,595,088 $ 2,702,238 $ 2,717,251 $ 2,650,009 $ 2,768,821 $ 2,771,796 $ 2,691,857 $ 2,879,525
Interest expense ................................................
.
640,875 697,070 772,504 857,021 966,424 965,151 964,101 1,067,608
N
et interest income ...........................................
.
1,954,213 2,005,168 1,944,747 1,792,988 1,802,397 1,806,645 1,727,756 1,811,917
Provision for loan and lease losses ...................
.
843,728 1,173,208 934,038 1,279,137 2,098,921 1,093,917 829,130 1,079,072
N
et interest income after provision for loan
and lease losses ...........................................
.
1,110,485 831,960 1,010,709 513,851 (296,524 ) 712,728 898,626 732,845
N
on-interest income (4) ....................................
.
1,411,752 1,552,368 1,232,189 1,089,844 1,368,286 1,696,891 1,622,316 2,056,478
N
on-interest expense, excluding restructuring
expenses ......................................................
.
1,915,956 1,775,701 1,878,340 1,727,662 2,705,104 1,794,900 1,806,041 1,769,518
Restructuring expenses .....................................
.
32,037 26,357 43,374 17,627 52,839 15,306 13,560 52,759
Income (loss) from continuing operations
before income taxes ....................................
.
574,244 582,270 321,184 (141,594 ) (1,686,181 ) 599,413 701,341 967,046
Income taxes .....................................................
.
170,359 145,212 92,404 (58,490 ) (289,856 ) 213,624 238,843 334,491
Income (loss) from continuing operations, net
of tax ...........................................................
.
403,885 437,058 228,780 (83,104 ) (1,396,325 ) 385,789 462,498 632,555
Loss from discontinued operations, net of
tax(2) ...........................................................
.
(28,293 ) (43,587 ) (5,998 ) (24,958 ) (25,221 ) (11,650 ) (9,593 ) (84,051 )
N
et income (loss) ..............................................
.
$ 375,592 $ 393,471 $ 222,782 $ (108,062 ) $(1,421,546) $ 374,139 $ 452,905 $ 548,504
N
et income (loss) available to common
shareholders ................................................
.
$ 375,592 $ 393,471 $ (275,936 ) $ (172,252 ) $(1,454,269) $ 374,139 $ 452,905 $ 548,504
Per Common Share:
Basic EPS:
Income from continuing operations .....
.
$ 0.90 $ 0.97 $ (0.64 ) $ (0.38 ) $ (3.67 ) $ 1.03 $ 1.24 $ 1.71
Loss from discontinued operations(2) ..
.
(0.07 ) (0.09 ) (0.01 ) (0.06 ) (0.07 ) (0.03 ) (0.03 ) (0.23 )
Net Income (loss) .................................
.
$ 0.83 $ 0.88 $ (0.66 ) $ (0.44 ) $ (3.74 ) $ 1.00 $ 1.21 $ 1.48
Diluted EPS:
Income from continuing operations .....
.
$ 0.89 $ 0.96 $ (0.64 ) $ (0.38 ) $ (3.67 ) $ 1.03 $ 1.24 $ 1.70
Loss from discontinued operations(2) ..
.
(0.06 ) (0.09 ) (0.01 ) (0.06 ) (0.07 ) (0.03 ) (0.03 ) (0.23 )
Net Income (loss) .................................
.
$ 0.83 $ 0.87 $ (0.66 ) $ (0.44 ) $ (3.74 ) $ 1.00 $ 1.21 $ 1.47
Dividends ..............................................
.
0.05 0.05 0.05 0.375 0.375 0.375 0.375 0.375
Market prices
High ......................................................
.
41.05 39.00 31.34 34.14 51.42 53.00 39.89 50.19
Low .......................................................
.
33.19 20.47 12.81 8.31 25.19 45.90 37.91 48.00
Average common shares (000s) .......................
.
449,987 449,409 421,851 390,456 389,008 372,928 372,348 370,743
Average common shares and common
equivalent shares (000s) .............................
.
454,916 453,726 421,851 390,456 389,008 374,293 373,653 372,272
Average Balance Sheet Data:
(In Millions)
Loans held for investment(3) ............................
.
$ 94,732 $ 99,354 $ 104,682 $ 103,242 $ 99,335 $ 98,778 $ 97,950 $ 99,819
Total assets(3) ...................................................
.
169,856 173,428 177,628 168,489 161,968 156,958 154,288 149,460
Interest-bearing deposits...................................
.
101,144 103,105 107,033 100,886 93,144 84,655 78,675 74,167
Total deposits ....................................................
.
114,597 115,883 119,604 112,137 104,093 95,328 89,522 84,779
Stockholder’s equity .........................................
.
$ 26,518 $ 26,002 $ 27,668 $ 27,004 $ 26,658 $ 25,046 $ 24,839 $ 24,569
(1) The above schedule is a tabulation of the Company’s unaudited quarterly results for the years ended December 31, 2009 and 2008. The Company’s common
shares are traded on the New York Stock Exchange under the symbol COF. In addition, shares may be traded in the over-the-counter stock market. There were
16,955 and 17,653 common stockholders of record as of December 31, 2009 and 2008, respectively.
(2) Based on continuing operations
(3) Certain prior period amounts have been reclassified to conform with current period presentation.
(4) Of which net realized gains (losses) on sales and calls of securities were as follows: Q4 2009- $20.7 million, Q3 2009- $151.6 million, Q3 2009- $44.6 million,
Q2 2009- $1.5 million, Q4 2008- $(0.3) million, Q3 2008- $0.9 million, Q2 2008- $4.2 million and Q1 2008- $8.9 million.
(5) Results and balances have been recast to reflect the impact of purchase accounting adjustments from the Chevy Chase Bank acquisition as if those adjustments
had been recorded at the acquisition date.