Capital One 2009 Annual Report Download - page 193
Download and view the complete annual report
Please find page 193 of the 2009 Capital One annual report below. You can navigate through the pages in the report by either clicking on the pages listed below, or by using the keyword search tool below to find specific information within the annual report.-
 1
1 -
2
-
3
-
4
-
5
-
6
-
7
-
8
-
9
-
10
-
11
-
12
-
13
-
14
-
15
-
16
-
17
-
18
-
19
-
20
-
21
-
22
-
23
-
24
-
25
-
26
-
27
-
28
-
29
-
30
-
31
-
32
-
33
-
34
-
35
-
36
-
37
-
38
-
39
-
40
-
41
-
42
-
43
-
44
-
45
-
46
-
47
-
48
-
49
-
50
-
51
-
52
-
53
-
54
-
55
-
56
-
57
-
58
-
59
-
60
-
61
-
62
-
63
-
64
-
65
-
66
-
67
-
68
-
69
-
70
-
71
-
72
-
73
-
74
-
75
-
76
-
77
-
78
-
79
-
80
-
81
-
82
-
83
-
84
-
85
-
86
-
87
-
88
-
89
-
90
-
91
-
92
-
93
-
94
-
95
-
96
-
97
-
98
-
99
-
100
-
101
-
102
-
103
-
104
-
105
-
106
-
107
-
108
-
109
-
110
-
111
-
112
-
113
-
114
-
115
-
116
-
117
-
118
-
119
-
120
-
121
-
122
-
123
-
124
-
125
-
126
-
127
-
128
-
129
-
130
-
131
-
132
-
133
-
134
-
135
-
136
-
137
-
138
-
139
-
140
-
141
-
142
-
143
-
144
-
145
-
146
-
147
-
148
-
149
-
150
-
151
-
152
-
153
-
154
-
155
-
156
-
157
-
158
-
159
-
160
-
161
-
162
-
163
-
164
-
165
-
166
-
167
-
168
-
169
-
170
-
171
-
172
-
173
-
174
-
175
-
176
-
177
-
178
-
179
-
180
-
181
-
182
-
 183
183 -
 184
184 -
 185
185 -
 186
186 -
 187
187 -
 188
188 -
 189
189 -
 190
190 -
 191
191 -
 192
192 -
 193
193 -
 194
194 -
 195
195 -
 196
196 -
 197
197 -
 198
198 -
 199
199 -
 200
200 -
 201
201 -
 202
202 -
 203
203 -
204
-
205
-
206
-
207
-
208
-
209
 |
 |

180
December 31
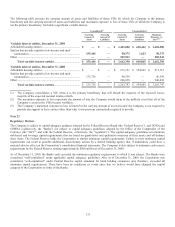
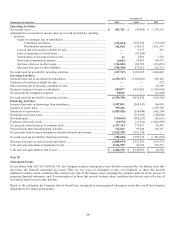
Statements of Cash Flows
2009 2008
2007
Operating Activities:
N
et income (loss) ........................................................................................................ $ 883,781 $ (45,998) $ 1,570,332
Adjustments to reconcile net income (loss) to net cash provided by operating
activities:
Equity in (earnings) loss of subsidiaries: ...........................................................
Continuing operations .............................................................................. (735,034) 1,289,184 (723,020)
Discontinued operations .......................................................................... 102,836 130,515 1,021,387
Loss on sale of securities available for sale ....................................................... — 9,353 223
Gain on repurchase of senior notes ................................................................... — (43,249) —
Amortization of discount of senior notes .......................................................... 61 2,864 7,293
Stock plan compensation expense ..................................................................... (6,881) 59,283 301,972
(Increase) decrease in other assets ..................................................................... (114,002) 106,782 (216,052)
(Decrease) increase in other liabilities ............................................................... (398,508) 673,561 522,714
N
et cash (used in) provided by operating activities .................................................... (267,747) 2,182,295 2,484,849
Investing Activities:
(Increase) decrease in investment in subsidiaries ....................................................... (2,250,327) (1,384,682) 969,122
Purchases of securities available for sale .................................................................... — — (127)
Proceeds from sale of securities available for sale ...................................................... — — 53,569
Decrease (increase) in loans to subsidiaries ................................................................ 689,077 5,414,902 (1,930,666)
N
et payment for companies acquire
d
.......................................................................... 30,856 — (10,464)
N
et cash (used in) provided by investing activities ..................................................... (1,530,394) 4,030,220 (918,566)
Financing Activities:
Increase (decrease) in borrowings from subsidiaries .................................................. 1,987,091 (268,347) 166,876
Issuance of senior notes .............................................................................................. 995,266 — 1,495,740
Maturities of senior notes ............................................................................................ (1,029,826) (550,000) (462,500)
Repurchases of senior notes ........................................................................................ — (713,383) (150,000)
Dividends paid ............................................................................................................ (318,844) (568,255) (42,055)
Purchases of treasury stock ......................................................................................... (14,572) (12,501) (3,024,969)
N
et proceeds from issuances of common stoc
k
.......................................................... 1,537,363 772,017 43,493
Proceeds from share based payment activities ............................................................ 116,023 95,048 192,361
N
et proceeds from issuance/redemption of preferred stock and warrant .................... (3,555,199) 3,555,199 —
N
et cash (used in) provided by financing activities .................................................... (282,698) 2,309,778 (1,781,054)
(Decrease) increase in cash and cash equivalents ....................................................... (2,080,839) 8,522,293 (214,771)
Cash and cash equivalents at beginning of year .......................................................... 8,546,995 24,702 239,473
Cash and cash equivalents at end of year .................................................................... $ 6,466,156 $ 8,546,995 $ 24,702
Note 28
Subsequent Events
In accordance with ASC 855-10/SFAS 165, the Company evaluates subsequent events that have occurred after the balance sheet date
but before the financial statements are issued. There are two types of subsequent events: (1) recognized, or those that provide
additional evidence about conditions that existed at the date of the balance sheet, including the estimates inherent in the process of
preparing financial statements, and (2) nonrecognized, or those that provide evidence about conditions that did not exist at the date of
the balance sheet but arose after that date.
Based on the evaluation, the Company did not identify any recognized or nonrecognized subsequent events that would have required
adjustment to the financial statements.